Data Analytics for Small Businesses: Where to Start With No Team and No Time
Most shop owners I’d describe this to would shrug. Analytics? Sounds like something for a company with an IT floor and a few people in lanyards. Meanwhile their own business produces data all day long.
Table of Contents
Think about it. A bill gets printed. A customer pays on UPI. Someone sends a WhatsApp asking if a thing is back in stock. A parcel comes back because the size was wrong. Each one is a tiny fact about your business, and almost none of them end up anywhere you can look at later. They sit in a billing machine, a phone gallery, a notebook with a rubber band round it.
So the problem usually isn’t a lack of data. It’s that nobody asks it anything. This post is about changing that, cheaply, without hiring anyone.
What this actually means for a shop or small firm
Forget the big words for a minute. At your size, analytics is just four habits. You record what happens in a consistent way. You look at the records every so often. You spot something odd or useful. Then you change one thing because of it.
You’ve probably done a rough version already. “Saturdays are dead, close early.” “Red kurtas always sell out.” That’s analytics with the numbers left out.
And the instinct isn’t worthless. Owners who’ve spent ten years behind a counter know things no spreadsheet will show them. But memory plays tricks. You remember the big dramatic sale and forget the dull steady one, so you can feel certain about your bestseller while a quieter product has been paying the rent. Checking is cheap. Being wrong for two years is not.
Pick one annoying question
People start by shopping for software. Bad idea, and I’d say so to anyone. Start with a question that bugs you at night.
Why is cash always tight when sales look fine? Which customers actually matter? Where do new people come from? Which product is really making money?
Choose one and ignore the rest for now. Six questions at once gives you a messy sheet you’ll quit by week three. And make the question something you’d recognise an answer to. “How’s my business doing?” can’t be answered. “Which five products earned the most profit last quarter?” can.
Dig out what you already have
You’ve got more than you think. Billing software is the obvious source, but also check your UPI and bank statements, GST invoices, supplier bills, WhatsApp Business chats, and whatever Google shows you about calls and direction requests. If you have staff, shift records count too.
It’ll be messy. Product names spelled three ways, dates missing, a few rows that make no sense. That’s normal, and honestly it’s the bulk of the work for everyone, professionals included. It gets faster with practice.
One small habit saves hours, though. From today, write things down the same way every time. If Monday’s entry says “Cotton Shirt M” and Tuesday’s says “shirt cotton medium”, your spreadsheet thinks those are two different products. Dull advice. Follow it anyway.
Sales: the monthly total hides everything
A monthly sales number is a headline with no story under it. Break it apart and things get interesting.
Rank your products by revenue, then rank them again by profit. The two lists rarely match. Something that sells in huge numbers on a thin margin can eat your time and cash while a slow seller does the real earning.
Look at days and hours next. Maybe Tuesday afternoons are empty and Friday evenings swamp your staff. Both are fixable once you can see them, with a small Tuesday offer or one extra pair of hands on Fridays.
If you have a year of records, compare month against month. Festivals, wedding season, monsoon slumps, exam rush. Knowing when demand climbs tells you when to buy stock and when to sit on your cash.
And if you sell through more than one route (walk-ins, phone, delivery apps, Instagram messages) compare them honestly. Some bring volume but take a commission. Others bring a handful of loyal regulars. You won’t know which you prefer until you’ve looked.
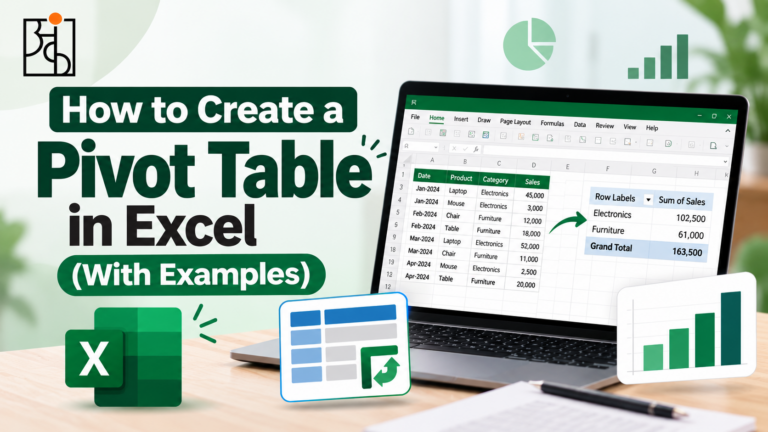
A pivot table in Excel or Google Sheets handles all of this. Nothing fancier is needed at the start.
Customers: who keeps coming back?
There’s an old rule of thumb that a small slice of customers brings in a big slice of the revenue. I can’t tell you the split for your shop. Odds are it’s lopsided, and you can check in an afternoon.
Sort people by what they spent over the past year and look at the top twenty. Do you know their names? Do they know you notice them? A thank-you message, first pick of a new batch, a quick call when their favourite item arrives. It costs almost nothing, and people remember it.
Then look at the other end. Plenty of people buy once and vanish. You can’t chase every one, but a friendly message to recent first-timers brings back more than you’d expect.
Two numbers are worth tracking. First, your repeat rate, meaning how many customers return within about two months. Second, your average bill. If repeat rate is low, more advertising won’t help, because your problem is keeping people. If your average bill hasn’t moved in a year, try a small bundle or a nudge at the counter.
Stock: cash sitting on a shelf
In many small businesses, money doesn’t vanish. It just sits there in the form of unsold goods.
Check what sells out, because empty shelves lose sales. Check what hasn’t moved in three months, because that’s your money standing still. Discount it, bundle it, or stop reordering. If you sell food or fashion, note what gets wasted or returned, since patterns show up fast. And glance at supplier invoices over time, because costs creep up quietly.
A simple sheet is enough: item, bought, sold, left, and a “last sold” date. That last column is the useful one, because dead stock jumps out immediately.
Picture a stationery shop with forty kinds of pen. After one quarter of tracking, the owner finds six of them make most of the sales and fifteen haven’t sold at all. Cut those fifteen and you free up shelf space and cash for the ones that earn. Nothing clever happened. Someone just paid attention.
Margins and cash flow
A lot of owners know their selling price and have only a vague idea of their real margin. Rent, power, packaging, delivery, card or UPI fees, staff time. All of it eats into the number, and most of it gets forgotten.
Try this once. Take your ten best sellers and work out what each really costs you, including packaging, a share of overheads and the discounts you usually give. Compare that with the price. Some “bestsellers” turn out to earn almost nothing. Some quiet products turn out to be your best earners. That changes what you promote and what you quietly drop.
Cash flow is its own animal. Profit on paper isn’t money in the bank. If customers pay late or suppliers want cash upfront, you can be profitable and still struggle with rent. A weekly sheet showing money in, money out and money you’re still owed will warn you about a squeeze weeks before it lands.
Read More : 10 Best Data Analytics Tools for Data Analysts in 2026: A Practical Guide
Marketing without guessing
Small budgets can’t afford guesses, so use the data to see what’s working.
Ask new customers how they found you, and write it down. It feels awkward for a week, then it’s routine. After a couple of months you’ll know whether people come from Instagram, word of mouth, Google Maps or just the signboard.
Then compare cost with results. If you put a few thousand rupees into ads, how many orders came from them? If one channel is cheap and brings steady customers, do more of it. If another eats money and brings nothing, stop. It sounds obvious, and yet most small businesses never check.
Be careful with discounts too. Note the dates and compare sales before, during and after. Sometimes a discount brings new people. Sometimes it just hands a lower price to people who’d have paid full price anyway.
Read More : Online vs Offline Data Analytics Course Which Is Actually Better?
A word on staff
If you have employees, the data can show where time goes. Compare orders per hour against people on shift. Check delivery times. Notice where complaints bunch up. You may be overstaffed in quiet hours and thin in the rush, and a small shift change fixes both.
Use this to improve the work, not to hover over people. If staff feel watched they hide problems, and then your data gets worse.
Tools: keep it boring
You can get a long way with free or cheap ones. Excel or Google Sheets covers most small businesses, and pivot tables plus basic charts put you ahead of most competitors. Many Indian billing apps already offer sales, stock and GST reports, so look at what you’ve got before buying anything. Google Looker Studio gives you free dashboards, and Power BI Desktop is free too once your data outgrows spreadsheets.
My advice is to stay in a spreadsheet until it genuinely hurts. Jumping to a bigger tool early just gives you a second thing to learn while you’re still working out what to measure.
If you’d rather not figure all of this out alone, that’s where we come in. At Ankashram, we help businesses turn the records they already have into decisions they can act on. Even if you do the basics yourself first, you’ll understand your own numbers better and ask sharper questions when you do bring someone in.
Read More : Data Analyst Course: Syllabus, Roles and What It Actually Costs in 2026
Where people go wrong
Collecting everything and using nothing is the big one. Gathering data feels productive. Acting on it is the point. If a number never changes a decision, stop tracking it.
Messy data is the next trap. Missing or duplicate entries skew your conclusions, so spend time cleaning before you draw big ones.
Vanity numbers tempt everyone. Follower counts and website visits are nice, but revenue, profit and repeat customers pay the bills.
Be a little sceptical of neat explanations too. Sales rose after you rearranged the shop. Was it the layout, or was it festival week?
Don’t overbuild. A three-column sheet you update every day beats an elaborate system you abandon in a fortnight.
And treat customer details with care. If you hold phone numbers or addresses, store them sensibly, don’t pass them around, and follow whatever data protection rules apply to you.
Read More : Data Analyst Interview Questions and How to Prepare
Thirty days, roughly
In week one, choose your question, list where the data lives and start recording consistently. In week two, pull the last three to six months of records into one spreadsheet and tidy names, dates and obvious errors. In week three, build two or three simple views: sales by product, sales by weekday, repeat customers. Look for the thing that surprises you. In week four, change one thing based on what you found, whether that’s a reorder level, a Tuesday offer or a message to lapsed customers. Then check the result next month.
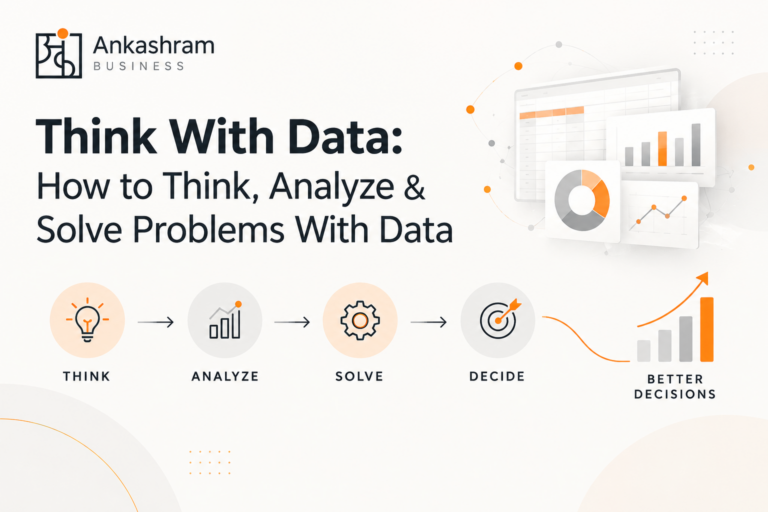
That’s one full loop of question, data, insight, action, result. Do it a few times and it stops feeling like a project.
Closing thought
Analytics for a small business isn’t about pricey software or specialists. It’s about swapping “I think” for “I checked” on the decisions that touch your money.
Start small. Your own sales sheet is a better teacher than any theory. And when your data outgrows a spreadsheet, or you’d like a second pair of eyes on it, Ankashram is here to help.
Frequently Asked Questions
Q1.Is data analytics really useful for a very small business?
Yes. Even a single shop can learn which products earn most, when customers show up and who comes back. Size isn’t the point. Guessing less is.
Q2.Do I need to hire a data analyst?
Not at the start. Most early wins come from basic spreadsheet work you can learn yourself. Think about outside help once your data gets complicated or you want regular dashboards.
Q3.What’s the cheapest way to start?
Excel or Google Sheets, plus whatever reports your billing software already gives you. Both cost little or nothing.
Q4.How much data do I need before it’s useful?
Less than you’d think. A few months of sales can already show patterns, and a year shows seasons. More helps, but you can begin now.
Q5.What should I track first?
Sales by product, sales by day and your repeat customer rate. These three usually show you something worth acting on within a week or two.
Q6.How often should I review my numbers?
Weekly for cash and sales, monthly for deeper things like margins and customer trends. Short and regular beats long and rare.
Q7.Is it safe to analyse my customers’ data?
Looking at it internally is fine, but handle it carefully. Collect only what you need, keep it secure and don’t share it without permission. Check the privacy rules that apply to your business.