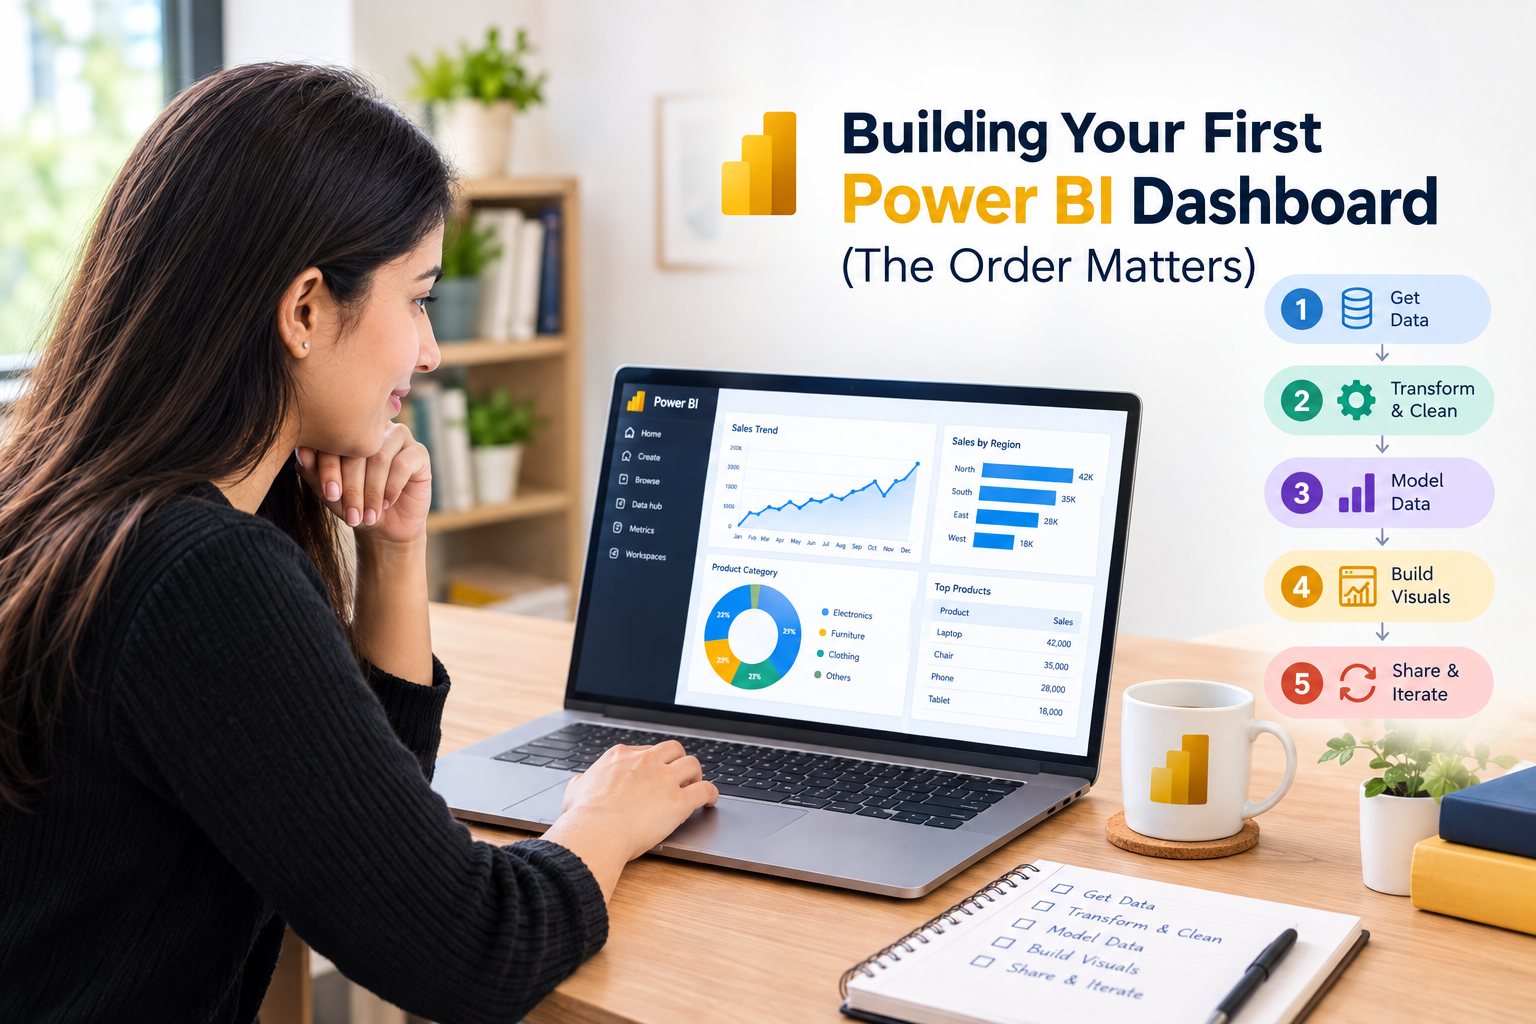
Building Your First Power BI Dashboard (The Order Matters)
Power BI for beginners can feel overwhelming. Open Power BI Desktop for the first time and you’ll probably want to close it again. Too many panes. A Fields list with nothing in it. Icons you can’t name.
Table of Contents
Open Power BI Desktop for the first time and you’ll probably want to close it again. Too many panes. A Fields list with nothing in it. Icons you can’t name.
Fine. Everyone feels that. Here’s what helped me stop feeling lost: the software isn’t hard, the order is. People skip ahead to charts because charts are the fun bit, then wonder why everything looks off. So we’ll go in the order that actually works.
Read More: How to Improve Logical Thinking: A Practical Guide to Thinking Critically
Decide what you’re answering
Before any clicking, write one sentence. Just one.
“Show sales” isn’t a question. “Which cities missed their target in the last quarter?” is. Everything you build afterwards either helps answer that or it doesn’t belong on the page. I’d say this one habit separates dashboards people use from dashboards people politely nod at.
Load your data
Download Power BI Desktop (it’s free), click Get Data, and ignore the huge list of connectors. Use an Excel or CSV file. Something you already understand, like a sales sheet or a list of your own expenses in rupees.
Don’t pick a messy, unfamiliar file for round one. You’d be learning a new tool and debugging bad data simultaneously, which is a miserable combination.
Power BI will offer Load or Transform Data. Press Transform. Always, even when the data looks fine.
Power Query is where the real work happens
This is the screen nobody shows off. It’s also where most of your time will go, and I’d rather you know that now than be annoyed later.
Start with dates. If Power BI reads a date column as text, time-based charts won’t work, and you’ll spend twenty minutes confused. Click the header, look at the little icon, fix the type.
Next, scan for blanks, duplicates and messy labels. “Delhi”, “delhi” and “DELHI” turn into three separate bars. Transform tab, Format, Capitalize Each Word, done. Takes seconds and saves a headache.
Happy with it? Close & Apply, top left.
Read More: How to Improve Logical Thinking: A Practical Guide to Thinking Critically
Two tables? Check the Model view
One table, skip this. With two (say, sales and a separate regions list) you need them linked. Open Model view. Often Power BI links them itself. If not, drag the matching field from one table onto the other.
That’s all a relationship is: telling the software these two columns mean the same thing. It sounds fussier than it is.
Your first chart
Go to the Report view. Blank canvas, Visualizations pane on the right.
Pick the bar chart. Put a category in Axis (Region, Product) and a number in Values (Sales). It fills in immediately, and honestly that’s a nice little hit of progress.
Now stop. Don’t pile on fields. Two or three is plenty, and a crowded chart explains less than a plain one. Add a line chart for sales over time and you’ve got the core of a dashboard already.
Read More: How to Think Like a Data Analyst (Even If You’ve Never Touched a Spreadsheet
Chart type is a choice, not decoration
Bars for comparing categories. Lines for change over time. Tables when people want exact figures; finance teams usually do, and they’re right. Pie charts? I’d avoid them past three slices, because nobody can compare angles by eye. A bar chart says the same thing faster.
Slicers
A slicer is a filter box you place directly on the page. Add one, drop Region or Year into it, click a value, and the other visuals on the page update to match.
This is the point where a dashboard stops being a picture and becomes something you can poke around in. Try it and you’ll see.
Read More : Online vs Offline Data Analytics Course Which Is Actually Better?
Make it readable
Don’t lose an evening to fonts and colour palettes yet. A few things do matter, though:
- Titles that say what the chart shows. “Monthly Sales by Region”, not “Sales”.
- Few colours, used consistently.
- Visuals lined up on a grid.
That last one makes a beginner’s dashboard look professional almost instantly, which still surprises me.
DAX, but only a bit
DAX is the formula language, and people dread it. You can skip it for a first dashboard and nothing breaks. If you want to try one measure, make it this:
Total Sales = SUM(Sales[Amount])
Why bother, when you could just drag in the column? Because measures respond to whatever filters are active, which matters once your slicers are in. Keep your first ones simple enough that you could explain them out loud.
Read More : Data Analyst Course: Syllabus, Roles and What It Actually Costs in 2026
Try to break it
Once it’s built, click everything. Every slicer, every combination. Read each title as if you’ve never seen the data. See what an empty filter does to a chart.
You’ll find problems this way that you couldn’t see while building, because after an hour your brain stops noticing what’s confusing.
Publishing
Needs a Pro licence or a company account with Power BI Service. Hit Publish and it goes to an online workspace. For practice, skip it. Building on your own laptop teaches you nearly everything.
What should you build?
Something small that you actually care about. Your monthly spending. IPL stats. UPI transactions from a public dataset. The subject barely matters; finishing does.
We push this at Ankashram a lot: ship one finished project, even an ugly one. It beats ten half-watched tutorials every time.
Read More : How Data Analytics Helps Businesses Think With Data
Frequently Asked Questions
Q1. Do I need DAX first?
No. Drag and drop gets you a long way.
Q2.Biggest beginner mistake?
Too many fields in one chart, and no clear question behind the whole thing.
Q3.Is it free to practice?
Yes. Desktop costs nothing. You only pay if you want to publish and share online.
Q4.Excel or Power BI to start?
If you’re completely new to data, Excel is gentler. Power BI pays off once your data gets large, you want interactive filters, or you’ll refresh the same report again and again.
Q5.How long will the first one take?
A few hours for something simple. Cleaning the data usually takes longer than building the charts, so don’t panic when that happens.
Q6.What dataset should I use?
Small, tidy and interesting to you. Your own expenses are a good one. Avoid messy files at the start.