10 Important Facts About Data Analytics Everyone Should Know
Data analytics is discussed all the time these days (in job ads, on LinkedIn, in every ‘future of work’ piece from the last 5 years). Somewhere in all that noise a huge amount of actually useful and practical information about the field gets lost under the barrage of buzzwords. Not the “AI is going to take over everything” kind of stuff. The more mundane, useful stuff. The stuff that actually changes the way you’d go about learning it, using it at work or even just getting a handle on what the people doing it are actually doing all day.
Table of Contents
Here are 10 facts that are worth knowing (the kind that actually stand up once you get past the surface level hype).
1. Most of the job isn’t analysis, it’s cleaning.
Ask any actual data analyst what takes up most of their week and the truthful answer is almost certainly not “building beautiful dashboards”. It’s data cleaning. The data cleaning. Fixing all the odd formats, hunting down the duplicates, working out why a column of dates ended up as text rather than dates. Some people put the data cleaning at 60-80% of the time spent by a typical analyst. This is quite a surprise to a lot of people who are getting into the field, as they’d have expected something much more like constant insight generation. The reality is rather more mundane (and actually quite important) in that a brilliant analysis based on messy data is still a wrong analysis. It’s just a wrong analysis that is confident in its wrongness.
2. Correlation doesn’t mean causation and it fools even experienced people
Everyone’s heard that phrase so many times it’s effectively become meaningless. It’s still going to catch the sharp, alert person though, time and again, usually in more subtle forms than the rather cliched ice cream and drowning example.
Two things moving together in a dataset don’t imply one caused the other. There’s almost always going to be a third factor that you need to look for before you jump to any kind of causal conclusion. There’s invariably going to be some third thing that’s driving both of them simultaneously, lurking just outside the dataset that you’re actually looking at.
3. A single average can mask two entirely different groups
An average is safe (one clean number, easy to report, easy to compare against a target). It’s also one of the easiest ways of inadvertently wiping out the actual story underneath it A company with an average satisfaction score of 7 out of 10 sounds perfectly reasonable on the surface. That figure could easily be the result of half the customers giving it a 9 or 10 and the other half giving it a 3 or 4, with very few actually in the middle. The real insight often lies in the distribution rather than the average alone.
4. Most data analysts use Excel rather than any of the ‘fancy’ tools
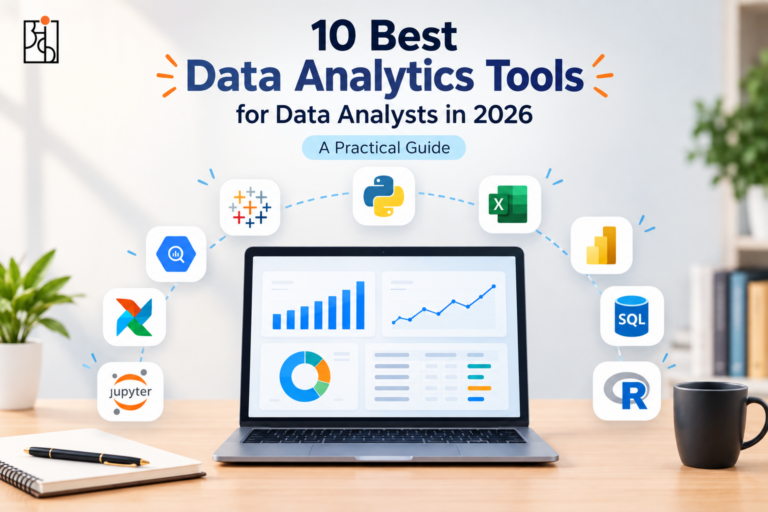
Python, SQL and the various specialist BI platforms all get a lot of attention. Excel on the other hand is by far the most widely used tool for day to day data work in most industries. It’s not particularly glamorous but it is very capable and most organisations already have it on every single computer without having to go out and buy anything.This is important for anyone just getting started who thinks they have to learn five rather complicated tools before they’re even “ready”. Excel in the right hands is absolutely capable of handling a massive amount of real world data work.
5. A small or biased sample can produce results which look just as confident as a solid one
This is one of the more insidious facts of data work in that a result based on a very small or biased sample doesn’t look in any way suspect from the outside. It looks just as clean and convincing as one based on a solid sample and that’s precisely what makes it so dangerous.
A feature was tested on 40 users of which 28 were positive. That’s enough to tempt a team into a company wide roll out – except 40 is small enough that a few very enthusiastic responses can completely skew the picture and lead you in a direction which won’t work at scale.
6. AI tools can write the code. They can’t decide what question to ask.
Modern AI tools have absolutely transformed the speed at which the ‘mechanical’ parts of data analysis can be performed (write a first draft SQL query, clean a dataset, generate a quick chart etc). What they’re still consistently terrible at is knowing which question you actually want to answer in the first place and whether their own confident-sounding answer is actually right.
This is actually more important every year as AI takes on more of the back end work. The real differentiator is the judgement to ask the right question and sanity check the AI’s output rather than just raw technical skill.
7. “Data-driven” doesn’t necessarily mean good decisions
A lot of organisations will proudly proclaim themselves to be data driven, when in reality they’re just using the data to justify decisions that have already been made for some other reason. That’s what we call ‘decision based evidence making’ (a cheeky inversion of the real phrase). Having a dashboard is not the same as actually allowing the evidence to change your mind when it’s going against what you already thought. A real data culture is one where you’re prepared to go out and find the version of the data that would prove you wrong rather than simply the version that supports your preconceived notion.
8. Most Data Analytics Roles Don’t Actually Require a Technical Degree
This is very surprising to a lot of people who are changing careers. There are absolutely plenty of working analysts who came from completely non-related backgrounds (commerce, biology, English literature, retail management etc) and then went on to develop their technical skills through deliberate practice rather than having done a proper computer science degree.
What matters more than the degree is a track record of actual projects: having asked a real question, wrestled with the messy data and arrived at a defensible conclusion. That’s something that can be built by almost anyone who’s willing to put in consistent hands-on practice.
9. A polished dashboard can still be completely wrong
A dashboard can be very well designed and presented and still be completely wrong.
This is one of the more unsettling facts about modern data tools. A messy spreadsheet looks messy and people instinctively take a cautious view of it. A clean, nicely formatted dashboard on the other hand looks credible by default, even if the data behind it has never been checked.
AI tools and automated dashboards will take whatever you feed them and process it exactly as you’ve fed it to them. They have no inherent ability to assess whether a number is plausible unless you specifically build that into the tool. A confidently wrong answer, presented in a well formatted manner, is actually more dangerous than a blatantly wrong answer because there’s absolutely nothing about the presentation that suggests it’s wrong.
10. The field rewards curiosity more than raw technical skill
This one always takes people by surprise. The people who go on to build real careers in this area aren’t necessarily the most technically proficient coders in the room. They’re the ones who will go “but why” one more time than is quite natural, who are a little suspicious of a result that just so happens to confirm what they already thought they knew and who actually enjoy getting their teeth into a nasty problem rather than just finding it a chore.
Technical skills are something that almost anyone can pick up with a bit of consistent practice. The underlying curiosity is much harder to teach directly and that’s precisely why it ends up being so important over the course of a long career.
Why These Facts Matter Together, Not Just Individually
It’s easy to just read this as a list of ten interesting facts/trivia points, each one in itself. In reality they’re all inter-related. The whole point about cleaning your data (fact 1) is there because if your input data is crap it will quietly break everything that comes after it (fact 9). The whole point about being wary of averages and small samples (facts 3 & 5) is the same as the point about correlation being misread as causation (fact 2) i.e. you can have numbers that look very confident and yet be completely wrong. The whole point about curiosity being more important than technical skill (fact 10) is the one thing that actually binds the whole list together. Data analytics is about people who are sceptical of their own conclusions, not people who just know the most tools. This is absolutely at the heart of what Ankashram is trying to achieve in terms of how people learn this discipline — it’s not about getting technically proficient with a particular tool, it’s about the fundamental habits of mind of questioning a result before you accept it, of checking an average before you report it and of treating a nice looking dashboard with the same level of scepticism as a messy spreadsheet. The tools and platforms will change every few years. Those ten points, largely, won’t.
Frequently Asked Questions
Q1.What’s the most surprising fact about data analytics for beginners?
Most of the actual work is data cleaning rather than building up the pretty charts and dashboards. The people who come in expecting to be generating insights all the time are frequently surprised at just how much time is spent on data cleaning (fixing the inconsistent formats, dealing with missing values, removing duplicates etc) before any actual analysis can take place.
Q2.Do I need a technical degree to work in data analytics?
No. A great many working analysts come from entirely non-analytical backgrounds and develop their technical skills through a process of deliberate practice rather than via a degree. In the interview context a portfolio of real, well-explained projects is far more important than the degree on the CV.
Q3.Why is it dangerous to just trust a clean looking dashboard?
As a polished dashboard doesn’t in any way visually indicate whether the data behind it has in fact been verified at all. A messy spreadsheet makes people cautious instinctively; a clean dashboard earns trust it may not have actually earned, which makes a confidently wrong conclusion harder to catch.
Q4.Can AI tools replace the need to learn data analytics fundamentals?
Not really. AI tools speed up the mechanical side of analysis significantly, but they still can’t reliably decide which question is worth asking or catch their own logical errors. That judgment still depends on a person who understands the fundamentals well enough to question the output.
Q5. What’s one habit that separates good analysts from the rest?
Staying genuinely curious and a little skeptical — asking “but why” one more time than feels natural, and deliberately checking for evidence that would disprove a conclusion rather than just evidence that confirms it.
Q6. How does Ankashram help people build these kinds of data analytics habits?
Ankashram focuses on the underlying thinking skills — asking sharp questions, checking averages and sample sizes before trusting them, staying skeptical of confident-looking results — rather than just teaching specific tools, since those habits are what actually make data analytics valuable in practice, year after year.