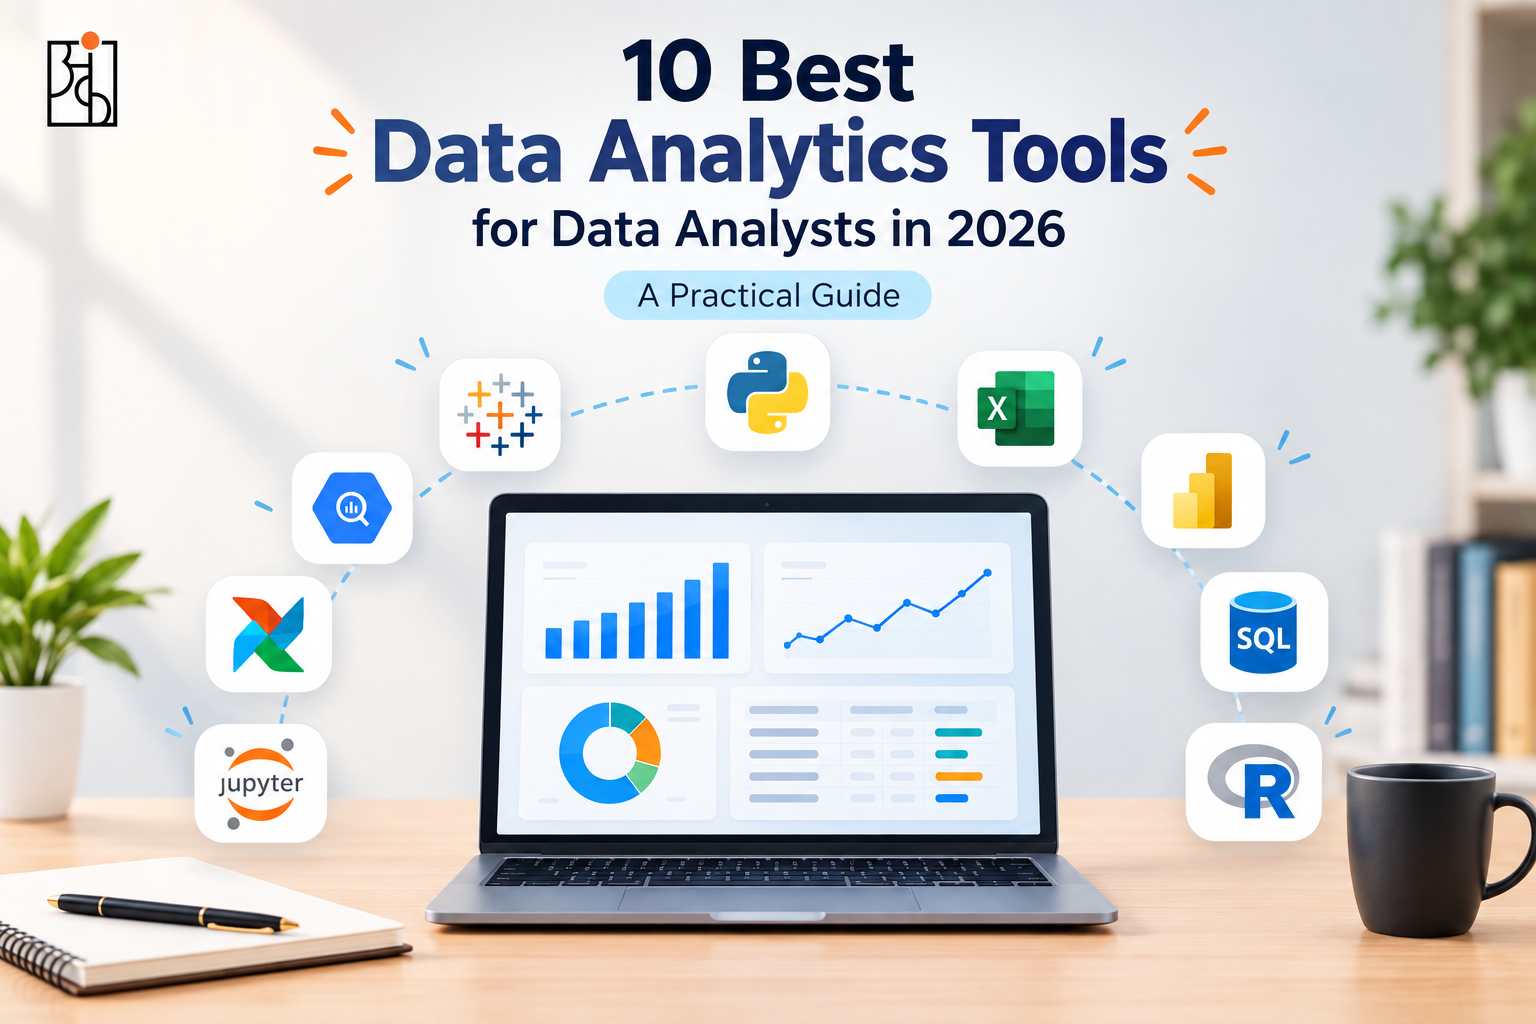
10 Best Data Analytics Tools for Data Analysts in 2026: A Practical Guide
A team lead I know spent a recent onboarding week watching her newest hire open six different applications just to answer one moderately complicated question about customer churn — a spreadsheet for the raw export, a separate tool to clean it, another to query it, a fourth to visualize it, and two more tabs open just to remember how the syntax worked in each one. Nothing about that workflow was wrong exactly. It was just needlessly scattered, built from whatever tools happened to get picked up individually over the years rather than a toolkit anyone had actually thought through.
Table of Contents
That scattered feeling is common, mostly because the list of things a data analyst could plausibly learn has gotten genuinely long, and not every tool on that list deserves equal attention. Some are foundational. Some are increasingly optional. A few are new enough in 2026 that skipping them means missing a real productivity shift, not just chasing a trend. Here’s a practical rundown of the best data analytics tools actually worth an analyst’s time this year, and what each one is genuinely good for.
1. Excel — Still Not Going Anywhere
It’s tempting to treat Excel as the tool everyone’s supposed to have outgrown by now, and the numbers simply don’t support that. A large majority of businesses still lean on Excel for ad-hoc analysis, and 2026 has actually made the case for it stronger rather than weaker — enhanced Power Query capabilities and direct Python integration mean a spreadsheet can now handle genuinely serious transformation work that used to require jumping to a separate tool entirely. For quick analysis, communicating with non-technical teams, or handling a dataset that doesn’t need warehouse-scale infrastructure, Excel remains the fastest path from question to answer that most businesses actually have.
2. SQL — The One Skill Nothing on This List Replaces

Every tool further down this page eventually touches a database, and SQL is still the language that gets you into it directly. No AI copilot or drag-and-drop interface has actually eliminated the need to understand what a join does or why a query returns the wrong row count. If there’s one item on this list worth genuinely mastering before anything else, this is it — everything else here either builds on SQL or exists specifically to give people who don’t know it a workaround.
3. Power BI
Power BI holds the top spot in Gartner’s 2026 Magic Quadrant for analytics platforms, and the Copilot feature built into recent versions is a real part of why — natural-language querying that actually lets someone type a plain-English question and get a working report back, without needing to write DAX formulas from scratch. For analysts working inside a Microsoft-heavy company environment specifically, Power BI’s tight integration with the rest of that ecosystem makes it close to the default choice rather than one option among several.
4. Tableau

For pure visual storytelling, Tableau still earns its reputation as the gold standard, particularly once a dataset gets large or a dashboard needs to feel genuinely polished rather than merely functional. Its AI-powered features have caught up considerably in 2026, speeding up the process of building a first-draft visualization, though the real differentiator remains what it’s always been — Tableau makes a chart look intentional in a way a lot of competing tools still don’t quite manage. Tableau Public, the free version, is also worth knowing about specifically for anyone building a portfolio, since it’s one of the more credible ways to show real visualization work publicly before landing a first job.
5. Python (With Pandas and NumPy)

Python remains the clear answer for anyone serious about growing past entry-level tool use, and Pandas and NumPy specifically cover the overwhelming majority of what an analyst actually needs from it — cleaning messy datasets at scale, automating a repetitive process, or running an analysis too complex for a spreadsheet to handle gracefully. This isn’t a tool to reach for on day one of learning data analysis. It’s the tool that becomes genuinely necessary once SQL and spreadsheets start hitting their limits, which for a working analyst tends to happen sooner than people expect.
Read More: How to Improve Logical Thinking: A Practical Guide to Thinking Critically
6. Looker Studio
Free and cloud-based, Looker Studio (the tool formerly known as Data Studio) fills a specific niche particularly well: fast, shareable reporting connected directly to live data, especially for anyone working with Google Analytics or BigQuery already. It won’t replace Tableau or Power BI for enterprise-scale dashboarding, but for marketing analytics or a smaller team that doesn’t want to pay for a heavier BI license, it covers a genuinely useful amount of ground for zero cost.
7. dbt
This one’s newer to a lot of analysts’ radar, and it’s worth understanding even for people who aren’t touching data pipelines directly. dbt lets analysts write modular SQL to transform raw data into clean, organized tables inside a data warehouse, and its real contribution is bringing actual software engineering discipline — version control, testing, documentation — into a part of the analytics workflow that used to run on a lot of undocumented, easily broken manual SQL scripts. As more companies push toward self-serve analytics, dbt is becoming the tool that keeps that self-serve data trustworthy rather than a mess of inconsistent definitions.
8. Hex

Hex represents where a lot of 2026’s genuinely new tooling is heading — a collaborative workspace that mixes SQL, Python, no-code elements, and AI-assisted cells in one place, including a Notebook Agent that can draft a starting query or a small app directly from a plain-language prompt. This matters less as a replacement for the tools above and more as a way of working across several of them without constantly switching context. For analysts on a team that collaborates heavily on shared analysis, Hex’s format tends to reduce a lot of the copy-pasting and version confusion that comes from passing spreadsheets and scripts back and forth over email or chat.
9. Sigma
Sigma solves a specific, common frustration: business users and analysts who want to explore a cloud data warehouse directly, at full scale, without needing to write SQL or pull an extract first. It puts a genuinely familiar spreadsheet-style interface directly on top of live warehouse data, which means someone comfortable in Excel can explore billions of rows without a steep new learning curve standing in the way. This is particularly useful in organizations where the data team has already invested in a proper warehouse but still gets constant requests from people who’d rather not learn a query language to use it.
10. Alteryx
Alteryx rounds out this list as the no-code option built specifically for data preparation and blending — combining, cleaning, and reshaping data from multiple sources through a visual, drag-and-drop workflow rather than written code. For analysts who spend a genuinely large share of their week on data cleaning (which, realistically, is most analysts) but don’t want to build that cleaning process in Python or SQL from scratch every time, Alteryx offers a repeatable, visual alternative that’s considerably easier to hand off to a colleague who isn’t a coder.
Read More: How to Improve Logical Thinking: A Practical Guide to Thinking Critically
Why This List Looks Different Than It Would Have a Few Years Ago
Compare this list to what would have shown up on a similar guide five years earlier, and the shift is worth naming directly. Nearly every entry here has picked up some form of AI assistance since then — Power BI’s Copilot, Tableau’s AI-powered chart suggestions, Hex’s Notebook Agent — which means the mechanical, repetitive parts of using these tools have genuinely sped up across the board. Writing a first-draft query, building an initial chart, cleaning an obviously messy column — all of this takes a fraction of the time it used to, regardless of which specific tool in this list someone’s using.
What hasn’t changed nearly as much is the judgment layer sitting on top of all that speed. An AI assistant inside Power BI can build a chart in seconds; it still can’t tell you whether that chart is the right one for the specific point you’re trying to make to a specific audience. A Notebook Agent inside Hex can draft a query fast; it still needs a human checking that the query’s logic actually matches the business question being asked. The tools have gotten faster. The reason a skilled analyst still matters more than the tool they’re using hasn’t moved an inch.
Read More: How to Think Like a Data Analyst (Even If You’ve Never Touched a Spreadsheet
There’s also been a real shift toward tools that reduce the awkward handoffs between a data warehouse and the people who actually need to use it. Sigma putting a spreadsheet interface directly on live warehouse data, and dbt bringing engineering discipline to how that warehouse gets organized in the first place, both point at the same underlying trend: companies want fewer translation steps between “the data exists somewhere” and “someone who isn’t a data engineer can actually use it responsibly.” That trend is worth watching closely over the next few years, since it’s likely to keep reshaping which tools on a list like this one matter most.
How to Actually Pick From This List
Nobody needs to master all ten of these, and trying to would be a genuine waste of time better spent going deep on the handful that actually matter for a specific job. SQL and spreadsheets remain the non-negotiable foundation regardless of which company or industry someone works in. One visualization tool — whichever matches the company’s existing tech stack, since Power BI and Tableau are both excellent and the “better” one is usually just whichever one your team already uses — covers most of the presentation side. Python becomes worth the investment once cleaning and analysis needs genuinely outgrow what a spreadsheet or a BI tool’s built-in features can handle. And the newer, more specialized entries on this list — dbt, Hex, Sigma, Alteryx — are worth picking up specifically when the job in front of you actually calls for what they solve, not because a trend list said they were 2026’s must-haves.
The team lead’s newest hire, eventually, cut her six-tool workflow down to three: SQL for the actual querying, a proper transformation tool instead of ad hoc spreadsheet formulas, and one visualization platform for the final output. Nothing about the underlying analysis got simpler. The path to producing it did, and that’s really the entire point of choosing tools deliberately instead of accumulating them by accident.
Read More : How to Get a Data Analyst Job: What Actually Moves the Needle
Frequently Asked Questions
Q1.Do I need to learn all ten of these tools to be a competitive data analyst in 2026?
No. SQL and spreadsheet fluency cover the majority of entry-level work on their own. The rest of this list is worth learning selectively, based on what a specific role or company actually uses, rather than trying to master everything at once.
Q2.Is Excel actually still relevant in 2026, or is that outdated advice?
Genuinely still relevant — a large majority of businesses still use it for ad-hoc analysis, and recent updates (Power Query improvements, direct Python integration) have made it more capable, not less, compared to a few years ago.
Q3.Should I learn Power BI or Tableau first?
Whichever one matches the company or industry you’re targeting tends to matter more than which is objectively “better,” since both are strong, well-supported tools. Power BI fits naturally into Microsoft-heavy environments; Tableau is common across a broader range of industries and slightly favored for pure visual polish.
Q4.What’s the biggest tooling mistake new data analysts make?
Trying to learn every trending tool on a list like this one simultaneously, rather than getting genuinely proficient in SQL and spreadsheets first. A strong foundation in those two makes every other tool on this list faster to pick up later, in roughly a fraction of the time it would take without that base already in place.