What Happens When Data Is Inaccurate?
One wrong number, entered just once, can quietly wreck tomorrow’s decisions before anyone notices. That’s not drama. It’s how data actually moves through most organizations.
Table of Contents
A single cell in a spreadsheet, a field on a form, a reading logged at 2 a.m. by someone half-asleep — it doesn’t stay put. It feeds dashboards, kicks off automated workflows, sets targets, and eventually sits in front of people making real calls. If that one entry was wrong, everything built on it inherits the mistake. Usually nobody realizes until the damage is already done.
This is the butterfly effect of bad data. Let’s walk through how it actually happens.
Garbage In, Garbage Out — Still the Oldest Rule
Every data person has heard this phrase so many times it’s lost its edge. It sticks around for a reason: it’s almost insultingly simple, and people still underestimate it constantly. A few ordinary examples make the point better than any textbook. Someone reads a review claiming a car gets 25 km/L. Once they’re driving it, the real number is closer to 10. Suddenly a carefully planned monthly fuel budget falls apart — not because of a bad financial decision, but because the input feeding that decision was wrong from the start. Or a food delivery order. The map pin drops one street over. Nothing else went wrong — restaurant, rider, payment all fine — and the food still ends up at a stranger’s door because one coordinate was off. Scale that up. Someone logs feedstock as 20,000 in a field meant for tons when the actual figure was 20. That’s not something you catch with a quick glance. The monitoring system treats it as real. It feeds into site targets. Every calculation downstream gets quietly distorted.
It Doesn’t Stay Where It Started
The initial mistake itself isn’t the real danger. Mistakes happen. The problem is how far a small local error can travel once it’s inside a connected system. In a plant operations setting, someone logs feedstock as 20,000 instead of 20 — a simple decimal-point slip. The dashboard has no way of knowing the number is absurd; it just shows it, scaled a thousand times past reality. Analytics flags it as an anomaly, not because anything unusual happened on site, but because the input was already broken. By the next day, real decisions about solid removal and water addition are sitting on a foundation that was never accurate. Or take an HR example. A reporting manager’s ID field is left blank, or someone types “N/A.” That one blank field can stop an automated performance review from ever triggering. No review. No alert explaining why. It’s a quiet failure, often only noticed days later after someone asks why a review never started, followed by hours of digging to find one missing value that should have taken two seconds to enter correctly.
Neither case involves a dramatic technical breakdown. Just one small human entry that the system trusted completely.
When This Happens at Scale, the Numbers Get Scary
It’s easy to think this stays limited to mild annoyances. Real cases from major organizations say otherwise.
A space agency lost a $125 million spacecraft because one team’s software used pound-force while the navigation team expected newtons. The unit mismatch sent the craft too low into the atmosphere and it was destroyed.
A trading firm had a trader who meant to sell a single share at a high price. The order went in as hundreds of thousands of shares at a fraction of that price — more shares than the company had ever issued. The loss ran into the hundreds of millions.
A major retailer expanding into a new country wrote down over $5 billion and closed more than a hundred stores, partly because product data for tens of thousands of items had no consistent standard. Inches mixed with centimeters, currencies mismatched, and only a small fraction of the data turned out to be accurate.
A global financial institution traced part of a multi-billion-dollar trading loss to a risk model running on manually copy-pasted spreadsheets, where one formula used SUM instead of AVERAGE and quietly cut the reported risk roughly in half.
None of these were exotic technology failures. Every one started with something almost embarrassingly small: one unclear unit, one mistyped quantity, one inconsistent format, one formula nobody double-checked.
A Quick Exercise: How Many Flaws Can Hide in Seven Rows?
One of the best ways to feel this is to look at a small, realistic data log and try spotting what’s wrong before it ever syncs into a live system.
- Imagine a shift log – a handful of rows recording feedstock input, digester level, pH, runtime hours, each tagged with a date, a site name, and who logged it. At first glance it looks ordinary. Look closer and it can hide a surprising number of problems across different categories.
- Reality- check failures: numbers that are physically impossible if you stop and think — a digester depth logged as 7,000 meters, a pH of 72 on a scale that only goes to 14, a runtime of 240 hours against a single day, a date claiming September has 31 days.
- Unit errors-a feedstock figure entered as 20,000 in a field meant for tons when the real number should be closer to 20 — a thousandfold gap behind one misplaced zero.
- Consistency failures: one row’s date formatted completely differently from the others, a site name typed lowercase in one place and capitalized everywhere else. A computer system will often treat those as two different locations.
- Ownership failures: a duplicated row, a blank field where someone’s name should have been. In an exercise built around a log like this, it’s genuinely surprising how many separate flaws can hide inside seven short rows. Most of the entries end up with at least one real problem, each capable of quietly distorting whatever system it eventually feeds.
Why AI and Dashboards Don’t Fix This
There’s a comforting myth that modern tools — AI models, automated dashboards, live monitoring platforms — have made this problem obsolete. Surely something that sophisticated will just catch and fix a bad entry on its own.
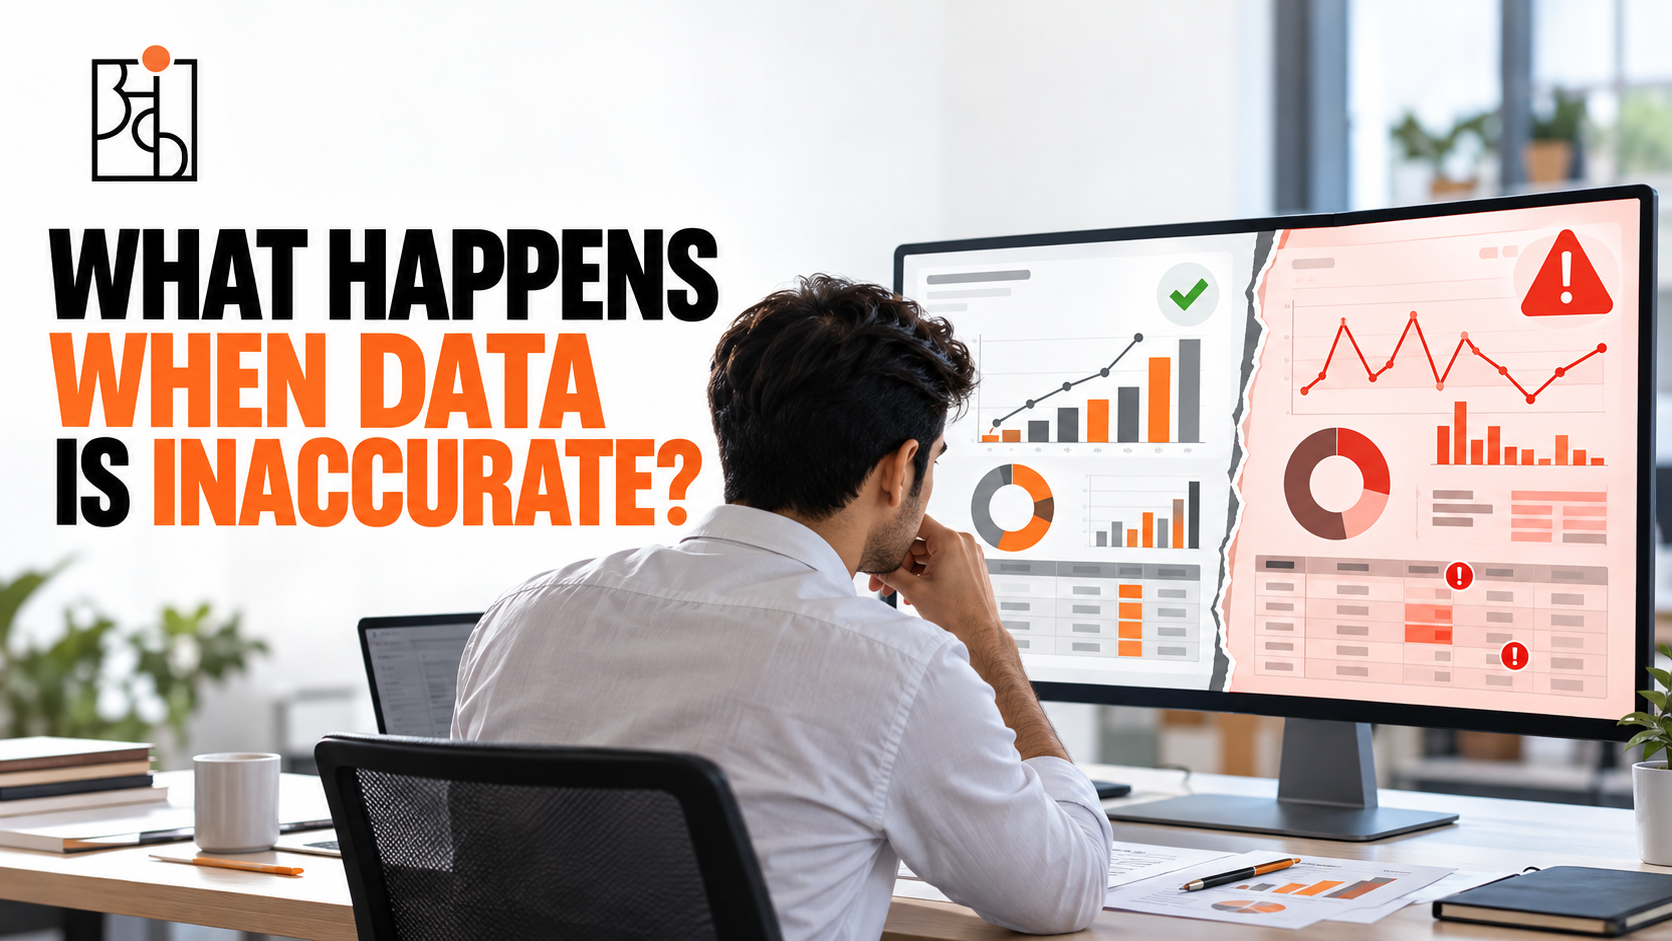
It won’t. These tools process exactly what they’re handed. A dashboard doesn’t stop to ask whether 7,000 meters sounds like a sane depth for industrial equipment. An AI summarizing a dataset has no idea a date format changed halfway down a column, or that “Site Alpha” and “site alpha” are meant to be the same place. None of that gets fixed behind the scenes. What comes out is often worse than an obvious mistake: a beautifully formatted, completely confident report that’s simply wrong, with nothing about how it looks giving that away. Leadership teams tend to trust a clean, professional-looking dashboard more than a messy raw spreadsheet — even when the dashboard is the one lying. If the underlying input was never checked for sanity, the tool doesn’t correct for that. It just presents a false picture in excellent packaging. That combination is exactly what makes it dangerous.
The Real Fix Is Boring — and That’s the Point
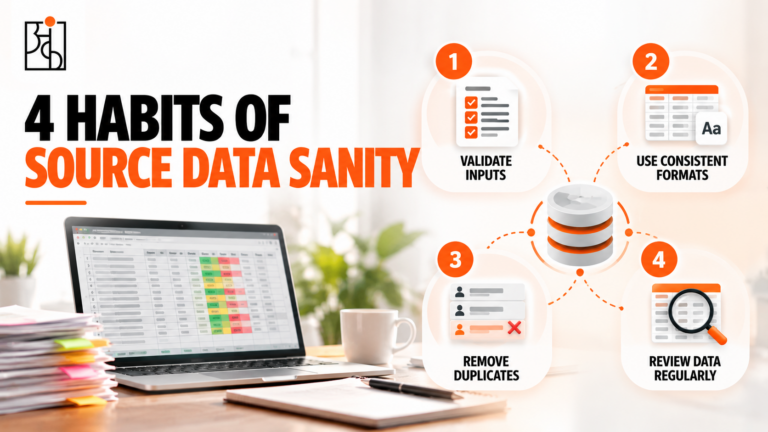
The fix isn’t smarter software. It’s a handful of unglamorous habits applied at the exact moment data first enters a system — before anything downstream can inherit the mistake. Build the unit into the field itself. A field labeled “Feedstock” invites a guess. A field labeled “Feedstock_In (T)” doesn’t leave room for one. Agree on bounds together and build them into the form. Settle on a realistic range for each parameter — digester level between 0 and 10 meters, pH between 0 and 14, runtime that can’t exceed 24 hours in a day — and let the system reject anything outside that range instead of hoping a human catches it later. Standardize the format so variation can’t sneak in. One date format, everywhere. A dropdown of valid site names instead of a free-text box where tiny spelling differences multiply into separate, disconnected entries. Name an owner for every field. Someone who knows the expected format, makes sure everyone entering data knows it too, and checks in periodically that it’s being followed — not once, as an ongoing habit. None of this needs new technology. It just needs people treating data entry as something other than disposable clerical work, because in reality it’s the foundation everything automated and analytical gets built on.
The Thing Worth Remembering
Inaccurate data rarely announces itself. It doesn’t look dramatic at the moment someone enters it. It looks like an ordinary row in an ordinary spreadsheet, typed quickly by someone with a dozen other things on their mind. The damage shows up later, somewhere else: a distorted target, a workflow that silently never fires, a dashboard confidently presenting a number that was never true.
This is the thinking Ankashram builds into its data culture training — not abstract theory about “data quality,” but the specific, practical habits that decide whether an organization’s numbers can be trusted once they land on a decision-maker’s screen. Treat every single entry like it matters, because somewhere downstream, for someone, eventually, it will.
Frequently Asked Questions
Q1.What does “garbage in, garbage out” actually mean in practice?
The quality of any analysis, dashboard, or automated decision can never be better than the data that fed into it. If the input is wrong — a bad unit, a typo, an inconsistent format — no amount of clever processing afterward fixes that.
Q2.Can one wrong data entry really cause major financial or operational damage?
Yes. There are well-documented real cases. A single unit mismatch, one mistyped order quantity, or one broken spreadsheet formula have each been tied to losses running into the hundreds of millions, sometimes billions, at large organizations.
Q3.Why can’t AI tools or dashboards just catch these errors automatically?
These tools process exactly what they’re given. They have no built-in way to judge whether a number is realistic unless someone specifically designed that check in. A flawed input often produces a confident, well-formatted, completely wrong output — which can be more dangerous than an obvious mistake because it looks trustworthy.
Q4.What kinds of errors show up most often in everyday data entry?
Four categories cover most of it:
– Implausible values that fail a basic reality check (a 240-hour day, for example)
– Unit mix-ups where something is recorded at the wrong scale
– Inconsistency in formatting or spelling for the same thing
– Ownership gaps — missing fields, duplicate entries, nobody responsible for catching mistakes
Q5.How can a team prevent this without buying new software?
Build the unit right into field names, agree on valid ranges for every parameter, standardize formats so variation can’t creep in, and give every data field a clear owner who checks on it regularly. Habits, not purchases.
Q6.Does this only matter for technical or data-specific roles?
Not really. Anyone whose work feeds into a shared system — logging operational data, filling out an HR field, entering a sales number — is effectively a data source for everyone downstream of them, whether or not “data” shows up in their job title.