How to create a data driven culture within your organisation
Ask most companies if they are data driven and they will say yes. But ask what it means and you will get some really vague answers. Someone might mention using a dashboard, another will talk about their analytics team. Another will say that they are investing in tools. This is the easy part. Buying a dashboard platform can be done in one week. However, creating a culture where people are in the habit of looking for evidence, challenging numbers and changing their minds based on the data is difficult to do.
Table of Contents
Whilst the word culture sounds very fluffy, it is a pretty specific thing. How do people behave when they aren’t being watched by senior individuals? Are they checking things before they say something? Are they asking what the number means? Do they admit that they don’t understand the chart? Here’s how we would do it.
What is a data driven culture?
It is useful to know what the culture looks like. Some indicators include:
- Using evidence as a normal part of meetings. Asking what is the evidence?
- Being ok to say I don’t know yet, let me check.
- Challenging what the numbers mean rather than arguing over who is correct in their spreadsheet.
- Sharing bad news quickly due to no one being punished for it.
- Reviewing decisions afterwards. Was it successful? What have we learnt?
- Data is not owned by one department. Multiple departments like sales, operations, HR, finance etc are using data.
None of these rely on having advanced technology. A small business with a shared spreadsheet can be much more data driven than a large business.
1. Start with leadership
This is the most important part. Most initiatives will fail here. People watch how leaders behave much more than what they say. If senior individuals only ask for data when they want to win an argument, the whole organisation will learn that data is a weapon. If leadership always overrides the data when they feel strongly, they will learn that the data is just a decoration.
There are a few simple things you can do:
Ask for evidence on your ideas. The most powerful thing a leader can do is to say let’s check if my plan actually works on a project they care about.
- Be open about changing your mind based on the data. This shows that it is a strength to change your mind.
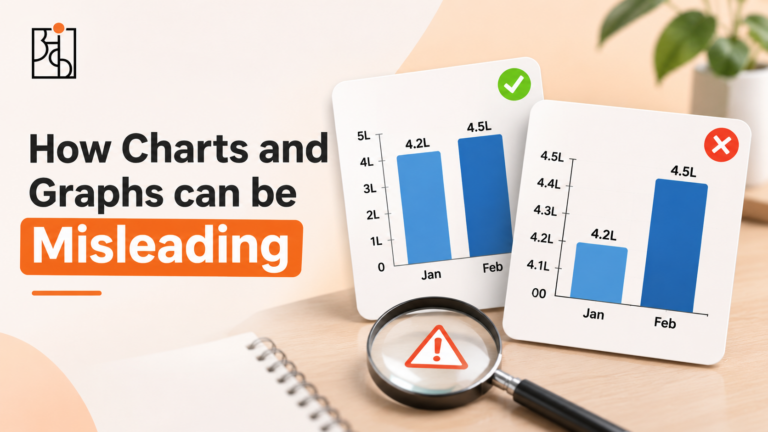
- Ask simple questions. This encourages everyone else to ask questions. Asking what is this axis starting at? or compared to what?.
- Don’t punish people for bad news. As soon as someone gets blamed for bad news the data will become nicer but less accurate.
- These are free. It does require consistency though.
2. Start with decisions
A common mistake is to start with technology. Picking a platform, connecting the data sources and building dashboards. This rarely works as no one has been asked what they actually need. Start with a few decisions that happen regularly. How do we decide which customers to prioritise? How do we plan stock for the next quarter? How do we decide where to spend our marketing budget? Pick 2 or 3 of these and look at how they are currently decided. What information are they using? What information is missing? What are they guessing? Improve how these decisions are made. Perhaps just having one report that is clearer, or having a shared definition. Encourage people to have a 5 minute habit of looking at last year’s data first. Small wins on real decisions will drive the culture much more than a big launch.
Read More: What Is Data Fluency? Why It Matters for Every Business
3. Improve the basics
You can’t build trust in data if no one trusts the data. Most of the time this is because of simple reasons. The same metric can be defined in 3 different ways. Numbers are being added in different units. Dates are in different formats. No one is sure which file is the most up to date.
- Start by getting definitions in place:
- Define what active customer, completed order or lead means. Have one place to store this with an owner.
- Have an owner for key data. Someone who knows what format they should be in, can tell people entering the data and will check occasionally.
- Build in validation. Add the unit to the field name. Add sensible parameters. Use drop downs. It is much cheaper to stop bad data going in than to try and clean it up.
- Agree on one source of truth. If there are two reports that don’t agree people won’t trust the data.
- AI and dashboards won’t help with this. They will just process whatever they are given. Having a nice report with inconsistent data will just mean you have a confident but incorrect report. The culture has to start with caring about the data from the start.
4. Ensure everyone is fluent
A data driven culture can’t be in just one department. If only the analytics team understand the data, everyone else is making assumptions. These will build up. The aim isn’t to make everyone an analyst. But to help people become comfortable using data. Asking a sharp question, reading charts with a little scepticism, understanding correlation vs causation and explaining findings in simple terms.
Read More: What Happens When Data Is Inaccurate?
Some tips:
Keep it short and interactive- We recently ran a series of workshops. 3 x 1 hour sessions helped us reach over 100 people. Over 80% participated in the interactive quizzes. Short, engaging sessions that people can fit into their actual work will get much more engagement.
Let people shape it-The series was initiated by employees. They told us what their challenges were and what they wanted to learn. Training that people have asked for will be very different.
Use real problems.-Using a messy spreadsheet from the business will teach more than a nice case study.
Involve everyone- Mixing departments together will help people see how their work links to others.
Thinking is more important than the tool.-Think With Data at Ankashram is about getting people across the organisation thinking critically and using evidence. The tools will support the thinking.
Read More: Why Your Business Dashboard Might Be Misleading You
5. Create a culture where people feel safe to challenge
No matter how much training you do, if people are scared then the culture won’t change. This can be shown in many ways. Nodding along to a chart they don’t understand. Hiding errors. Tweaking numbers.
Creating a safe environment-Thank people for finding issues. Especially if it is their own data. Finding issues early is cheap. Hiding issues is expensive.
- Encourage people to say I don’t understand this. This is a useful contribution.
- When decisions go wrong, ask what the team knew and what would help next time. Don’t blame anyone.
- Challenge positive news. If people only challenge negative news they will learn that they should be scared to challenge.
- A team that feels safe to say this doesn’t look right will find issues that no tool can.
6. Provide access
If people can’t access the data they can’t use it. If they have to ask one busy analyst all their questions most won’t get asked. Those that do will be too late. Make the basics easy to access. Shared, clearly labelled reports. A short description of what each metric means. Clear place to ask questions. Where possible let people explore. However, you want to provide some controls. If people have full access to undefined data they will have 10 confident but inconsistent answers. If you have shared definitions plus a few simple rules on privacy and sensitive data you will have a balance between freedom and clarity.
7. Create a loop
One of the quickest ways to create a culture is to show people that evidence is actually influencing decisions. One of the quickest ways to destroy a culture is to have reports that are created, presented and forgotten.
Create a loop:
Note what evidence was used when making a decision. What would have changed the plan?
- Review afterwards -Was it successful? What have we learnt?
- Share stories-Telling people that we changed our delivery schedule because the data showed X will do more than any slogans.
This is more important than you may think. People will copy what is recognised. If a team sees a colleague praised for finding an issue with a report or changing direction due to new evidence they will learn what is valued.
Read More: 5 Questions to Ask Before Putting Your Faith In Data
8. Monitor
It can be tricky to measure a culture but there are some indicators:
- Are people asking for data in meetings?
- Are people less likely to argue over whose number is correct?
- How quickly can common questions be answered?
- Are decisions being reviewed?
- Are people from different departments using the same definitions?
- Are newer/junior members feeling safe to challenge a chart?
You don’t need an elaborate scoring system. Doing a quick check in every few months asking people honestly what is working and what is holding them back will give you more information than most dashboards.
Common pitfalls
- Trying to start with tools.
- Having one bottleneck. Creating an analytics team to answer all questions.
- Creating dashboards that no one will open. Creating reports without asking who will be using them and what decision they are for.
- Using data as an excuse. Only using data to back up decisions.
- Punishing bad news. Teaching people to hide issues.
- Trying to do too much. Big programmes won’t get traction. Small regular changes will.
Getting started
If all of this feels like a lot to do then start small. Here’s a gentle 90 day start.
Month 1: Listen and select. Talk to people from different departments and find out where data is helping and causing frustration. Select 2 or 3 decisions that happen regularly that you want to improve.
Month 2: Improve and train. Define what the key metrics mean. Define owners. Run your first short interactive session with a mix of departments.
Month 3: Showcase and review. Showcase one improved decision. Tell people what has changed. Ask people what is working and what isn’t. Decide what to do next.
This isn’t a full programme but is a great way to get started and gain genuine feedback.
Why it matters even more now
AI is making the mechanical side of data quicker every month. Whilst this is helpful, it means the human side is more important. A tool can give you an answer in seconds and will be completely confident in it (whether it is right or wrong). Someone needs to know what to ask, check the answer and decide if it fits the actual problem.
Organisations with a strong data culture will get the most out of AI as people know how to challenge the output. Organisations without will trust the confident answers they can’t assess. The technology is available to everyone but the thinking culture is what will set organisations apart.
This is what we do at Ankashram We run bespoke data culture workshops based on our Think With Data approach. We help teams develop habits of asking sharp questions, critically analysing evidence and making joint decisions. If you’d like to talk to us about your organisation we’d be happy to hear from you.
Frequently Asked Questions
Q1.What is a data driven culture?
A culture where people at all levels of the organisation are regularly using evidence to make decisions. They are open to challenging numbers and are willing to change their mind based on the data. It is defined by behaviours and attitudes.
Q2.How long does it take to create a data driven culture?
It can vary. Whilst visible changes can be seen in a few months (clearer definitions, better questions in meetings) it usually takes longer to change behaviours and thinking. This comes from regular practice.
Q3.Do we need to employ data scientists?
Not necessarily. Whilst having specialists can help, a data driven culture relies more on people using the information in their daily work. Many organisations find they get more value from improving data fluency across teams.
Q4.What is the biggest barrier to creating a data driven culture?
Often it is fear or habits. If people are worried about being blamed for bad news or leadership overriding the evidence when it is inconvenient, teams won’t trust that the data matters. This can be overcome by changing how leaders behave.
Q5.Is it only for large companies?
No! Small businesses can create a data driven culture and often quicker. Having clear definitions for key metrics and a habit of asking compared to what? can make a real difference.
Q6.How can Ankashram help organisations create a data driven culture?
We run bespoke, interactive data culture workshops based on our Think With Data approach. We tailor them to the issues and questions within your organisation. We help people from different departments to challenge assumptions, critically analyse evidence and make joint decisions.