Why Your Business Dashboard Might Be Misleading You
Misleading dashboards can lead businesses to make incorrect decisions, even when the underlying data is accurate. The way information is presented, including averages, chart scales, selected time periods, and missing comparisons, can create a false impression. In this article, we explore 10 common ways dashboards can be misleading and explain how businesses can identify these issues before making important decisions.
Table of Contents
1. The Average Which Masks Two Separate Stories
Averages are the preferred tool of those who put together dashboards and are at the same time one of the simplest methods of hiding what is actually happening.
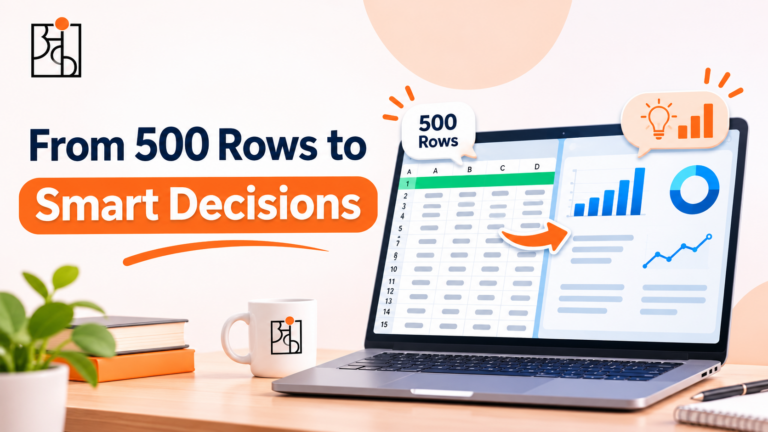
If the dashboard indicates an average delivery time of three days, that may seem acceptable. However, that figure could be based on the majority of orders arriving within one day while a significant number take nine days. The customers who are waiting nine days are not experiencing the ‘average’ one; they are having a poor experience, and the headline figure has simply ignored them. The solution is rather dull. Instead focus on the spread rather than just the centre. Often a median alongside the mean, a simple histogram, or the proportion of orders that exceed a certain threshold will tell you more than the average ever could.
2. A Chart That Begins at the Wrong Point
Note the point at which the vertical axis starts; if a bar chart begins at 90 rather than at 0, a change from 94 to 97 may appear as if the figures have doubled. Although the data is accurate, the image has a dramatic effect that doesn’t reflect the actual situation. It is not always carried out with the intention of deceiving; at times the tool selects the axis range by itself and no one takes the trouble to verify it. The outcome is the same in such cases: a slight and normal wobble is interpreted as a surge or a collapse, and people respond to what they see rather than to what the figures really indicate.
A good habit in this situation is to check the axis labels first and then the shape before you react to any chart.
3. The Time Period That Was Chosen by Someone Else
A dashboard typically starts with a default time frame, for example the previous 30 days or the current quarter. That time frame is an option and in a quiet way influences the narrative.
If you compare this month with last month you could observe an increase, but if you compare it with the corresponding month last year you might see the opposite result. A business which has a strong festive season will appear excellent during the weeks surrounding that season and will have flat sales for the rest of the year, and a dashboard that only displays the most recent period will make a normal seasonal pattern look as though it is a trend. Before you accept any figure shown on a dashboard, you should consider what took place over a longer period of time and check whether the same dip or spike occurs every year. If it does, then it’s not news—it’s just a result of the calendar.
4. Totals That Eat Up the Segments
It is convenient to have a single combined figure for the entire business, since it is frequently in this single figure that the real problem lies. The total revenue might remain unchanged while one product line is growing rapidly and another is slowly declining, the two offsetting each other so exactly that the total reveals nothing whatsoever.
It can become even more bizarre. A trend may show one direction within each individual group but go the other way when the groups are combined—that is, when the mix of customers or products changes as a whole. The dashboard displays a single confident line, even though this is not true for any of the individual segments. When a figure is important, it should be broken down according to region, customer type, product, and channel. The total figure should be regarded merely as a starting point and not as a final judgment.
5. Metrics That Appear Impressive but Do Not Relate to a Decision
Certain figures end up on a dashboard not because they are useful for anything, but simply because they are easy to obtain and pleasant to observe. Examples of such figures include page views, follower counts, the total number of sign-ups, and the number of reports generated, all of which increase as you move from left to right and none of them actually indicate whether the business is in a healthier state. The best way to tell is to consider how your actions would change if the figure were doubled or halved. In this case, if the response is “nothing”, then the metric is merely decorative. Since the tiles on a dashboard have to compete for attention, those which are decorative may end up blocking the ones that really need a second look.
Read More: How Humans Analyze: The 4-Step Mind Model
6. Numbers with no baseline
No one can judge whether it’s good just from the title alone. A number with no point of comparison is merely a number; if there’s no target, no figure from the previous period, and no benchmark for your kind of business, the viewer has to decide whether to feel pleased or concerned and generally makes that decision on the basis of the current mood. Dashboards which include context—such as the goal, the figure from the previous period, and the normal range for that metric—are much easier to interpret incorrectly than those which display just a single large figure.
7. Definitions That Gently Shift
It’s easy to overlook this point since nothing appears to be amiss. How do you define an ‘active customer’? For example, does that mean someone logged in this month, made a purchase this quarter, or opened an email? If the definition of an active customer is altered halfway through the year or if two different teams have their own definition, the dashboard will show a sudden increase or decrease that is completely due to the change in definition and has nothing to do with the business.
It’s worthwhile investigating whether there has been any change in the way a metric is counted whenever it shifts sharply, since the cause is surprisingly frequently to be found there, not in customers’ behaviour.
8. Charts Which Suggest a Cause
If you place two lines side by side on a dashboard, the eye will tend to join them together. When marketing expenditure increases, sales also rise and it seems as though one has caused the other. It might be that one did. Alternatively, both of them could have been influenced by a seasonal peak, a change in price, or a competitor running out of stock. A dashboard usually doesn’t display the other factors that were involved, since it can only show those that have been selected. When looking at side-by-side trends, take them as a starting point for a question rather than as an answer.
9. Data which doesn’t appear as up-to-date as it does
A dashboard that looks clean and up to date might be based on data that was last refreshed overnight, last week, or only when someone forgot to update the source. If decisions are being made at the moment on figures that are already out of date, then the dashboard is in effect portraying a business that no longer exists.
Look at the ‘last updated’ time, and if it’s not there on the dashboard then that should be sorted.
Read More: What Happens When Data Is Inaccurate?
10. The Powerful Effect of Appearing Official
One of the main reasons why dashboards are misleading is the way they appear. People tend to be cautious almost instinctively when faced with a messy spreadsheet. In contrast, a well-presented dashboard featuring branded colours and clear charts suggests that it has been checked, even if no one actually has. That doesn’t refute the value of dashboards since they are very useful; rather, it suggests that a finely presented dashboard should be examined in the same way as a crude spreadsheet, since a wrong figure that appears confident spreads much more easily than one that is clearly unreliable.
How to Audit a Dashboard Before You Trust It
You aren’t obliged to have a degree in statistics in order to do this; a few questions will pick up the majority of the problems:
- What is the axis doing? – Look at the starting point and check if the scale is amplifying a small change.
- What time period are we considering? Verify if the same pattern appears in earlier years.
- What’s inside the total? Divide the headline figure into the relevant sections.
- When is it being compared to? Identify a target, a prior period, or a benchmark.
- What is the definition of this metric, and has that definition changed?
- Would my behaviour change if that figure changed? If it didn’t, then one should ask why it is displayed.
- What was the last time this data was updated?
They take about two minutes and that’s the difference between merely reading a dashboard and having one guide you.
The Skill Underneath the Tool
This does not provide a reason to give up on dashboards or to lose faith in data. Rather, it is about viewing a dashboard as the opening of a conversation, not its conclusion. The tool reveals what someone has decided to display; your responsibility is to consider the things they have left out.
The habit is the one that forms the basis of our Think With Data approach at Ankashram. Although software changes every few years, the tendency to ask “comparisons to what, and what is missing from this picture?” remains useful no matter what tool you are looking at. Teams that develop it will make fewer confident mistakes just because more people in the room are free to question the chart before taking action.
Read More: Custom Corporate Training in Data
Frequently Asked Questions
Q1.Can a dashboard give a misleading impression even if the data is correct?
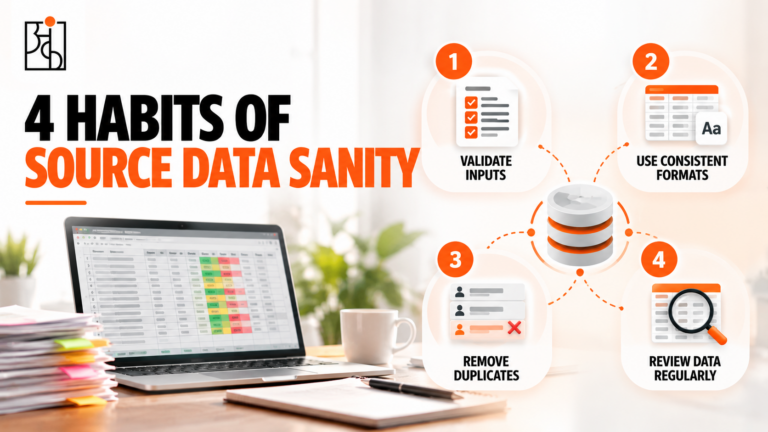
Right: accurate data can still be misleading due to the way it is presented, for example by using averages which conceal uneven distributions, by having axes that exaggerate minor changes, by selecting time periods which make seasonal patterns appear as if they are trends, and by giving totals which mask the differences between the various segments.
Q2.What is the most frequent manner in which dashboards deceive people?
It’s about average. While a single average is simple to show and simple to read, it can mask quite different experiences beneath it, and looking at the spread of the data together with the average reveals many problems.
Q3.What is the way of telling whether a chart’s axis is misleading?
Consider the point at which the vertical axis begins and the range it includes; if a bar chart starts well above zero, small differences can appear very large. It is a fast and useful thing to check the labels on the axis before forming an opinion about the chart’s shape
Q4.Why is the time range shown on a dashboard so important?
The story is shaped by the length of the time period that is chosen. If a short, recent period is used, a normal seasonal variation can appear to be a new trend, whereas comparing the same length of time from year to year will show whether or not it is actually unusual.
Q5.What questions should I pose before I put faith in a dashboard?
Find out what the axis represents, which time period is being displayed, what is concealed within the totals, against what the numbers are being compared, how each metric is defined, whether or not the metric would influence the decision, and when the data was last updated.
Q6.In what way does Ankashram assist teams in reading dashboards more critically?
By using its Think With Data approach, Ankashram aims to develop the habit of questioning any figure before taking action, enabling people at all levels to notice what a chart omits and to ask better questions of the tools they currently use.