How To Design An HR Dashboard In Excel
Table of Contents
Most HR teams will have this problem. You’ve got some data, but it’s all in different files. Perhaps one file contains all your headcount, another contains all your leavers. Perhaps your vacancies are lurking in an email thread. When a manager is asking you a question about attrition, suddenly you spend the entire afternoon hunting for the answer.
With a dashboard, all data is in one place – you don’t even need Power BI. This will be perfect for small to medium-sized teams.
What metrics would you like to track?
Determine what questions consumers ask you. Those are your metrics. Possible metrics are:
- Total headcount
- New hires last month or quarter
- Attrition rate
- Average tenure
- Open job openings & duration to fill
- Absence
- Gender or diversity breakdown (if you keep track of this)
- Training completed
Number of metrics to track: Pick between 5-7 metrics. There may be a desire to track more but ensure not to clutter the dashboard.
Step 1 – Prep Your Data
Create a sheet with all of your Employee Data. Include:
- Employee ID
- Name
- Department
- Job Title
- Date Hired
- Date Left
- Status (Active / Left)
- Location
- Gender (if applicable)
Select any portion of the data and hit Ctrl+T and make the data an Excel Table. It may seem trivial, but it is so helpful. When you enter your new employees next month, all of your formulas and charts will include them.
You can also insert anything that isn’t about your staff (vacancies) in a second sheet.
Read More: How to Think Like a Data Analyst (Even If You’ve Never Touched a Spreadsheet
Step 2 – Compute Your Metrics
Maybe easier to just add them onto a separate sheet. You could add them directly to your dashboard, but it can get crowded and cluttered. Make a cell for each, adding in the title heading.
With a COUNTIF Formula Count all active employees in the status column. Use the total number of employees to add a headcount.
The number of new hires can be calculated by counting the number of new hires within the monthly/quarter period of time being monitored.
To calculate you need to divide your leavers by the average headcount over the period and muliply by 100. Leavers/average headcount over periodx 100. For example: you had 6 leavers over a period of time and you had an average headcount of 120 your attrition will be 5%. Remember to use the average headcount!
We can use the YEARFRAC function to do this easily. (A note – you can also use DATEDIF but this is an old function and slightly obscure).
Use a COUNTIF formula on your vacancy list.
Read More: Why Data Analytics Projects Matter So Much for Beginners
Step 3 – Dashboard Design
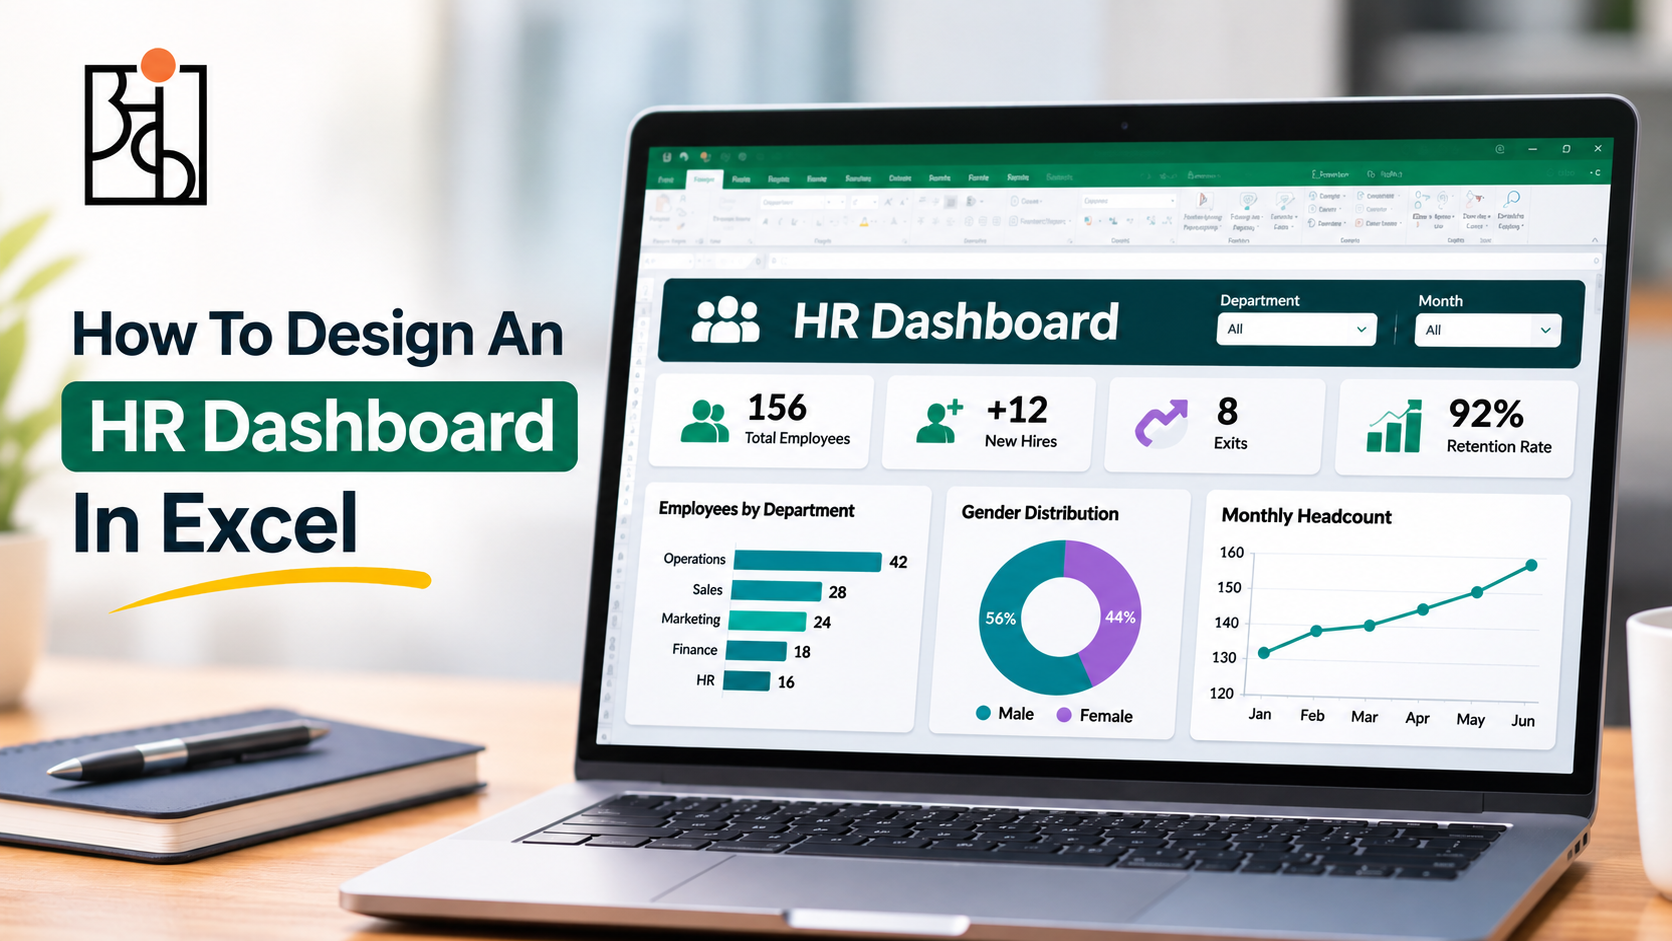
Create a new sheet called HR Dashboard. Put your key metrics at the top, in bold. They should be able to get an instant snapshot of how many people you have, how many new people you are hiring, how many people have left, how long they are staying and how many vacancies you have in under 5 seconds.
Below this add a few examples of charts. A column chart for the headcount by department. A line chart for the new hire rate. A line chart for leavers for the last 6-12 months. A pie chart of your metrics by location or other category. A small table of recent hires and leavers.
Step 4 – Simple Charts
Emphasise your summary data. Head to Insert and select your chart. From here you will need to tidy up your chart. Delete grid lines and legend if you only have one series. Stick with the same colours in all your charts. All your charts should have clear titles. Label your axes clearly so someone who doesn’t know the data can understand.
For your key KPIs then you could create a large combined cell. Insert bold text. Or you could add a shape then link the cell to your calculation. Type = then select the cell in the formula bar.
Step 5 – Filtering
You can enable filtering by department, or date of visit. Create a data validation dropdown using a link to your formulas. Or if you’ve used pivot charts, create slicers. It’s not needed and you can create a static dashboard to start with, and add this feature in if needed.
Step 6 – Clean Up & Test
Use one font. Make sure your dashboard is lined up. If the boxes are not lined up it looks sloppy. Include a date showing when the dashboard was last updated.
If a file will be viewed by others, we need to protect our sheets. Make sure we unprotect the cells in which your data is written so that users who are inputting data can write there.
Test it! Make a few changes to your source data. Ensure the KPIs and charts update correctly. You really don’t want a director to notice when you are presenting during a meeting, that there is a broken formula.
Tips For Keeping Your Dashboard Useful
Store your raw data, separately. Give a simple explanation to every one of the KPIs that you present. You will be asked. Keep it fresh, if no one is looking at a certain chart, take it away.
We use this approach at Ankashram as part of our programmes, for example, Think with Data. The ideal dashboards are those that can be opened and can be immediately understood and then used to inform a decision.
Frequently Asked Questions
Q1.Are Pivot Tables required?
It can be done with COUNTIF, SUMIF and AVERAGEIF functions. Pivot Tables might also help you regroup and slice your data.
Q2.How frequently should I refresh my dashboard?
The majority of the numbers can be refreshed monthly. For some teams, these numbers will be refreshed more often.
Q3.What if my managers aren’t confident with Excel?
Don’t overcomplicate. Don’t expose your computation worksheets. Also provide a couple of lines of help instruction for using the data. Send a PDF version as well.
Q4.What is the most common mistake?
Too many metrics. 5 metrics that matter to people will be more powerful than 15 metrics that no-one is paying attention to.
Q5.How does Ankashram teach this?
We provide real-world examples. You will leave with tools for your workplace tomorrow.
Q6.Will I use Excel or Power BI?
Use Excel until it can’t handle it. When it gets large or you need it handled by multiple people or want it to auto refresh from other systems, then it makes sense.