How to Calculate Month-on-Month Growth in Excel
Month-on-Month Growth shows how much something has grown or decreased from one month to the next. It is one of the simplest and most useful ways to track progress in sales, revenue, website traffic, sign ups, or any metric that changes over time.
Table of Contents
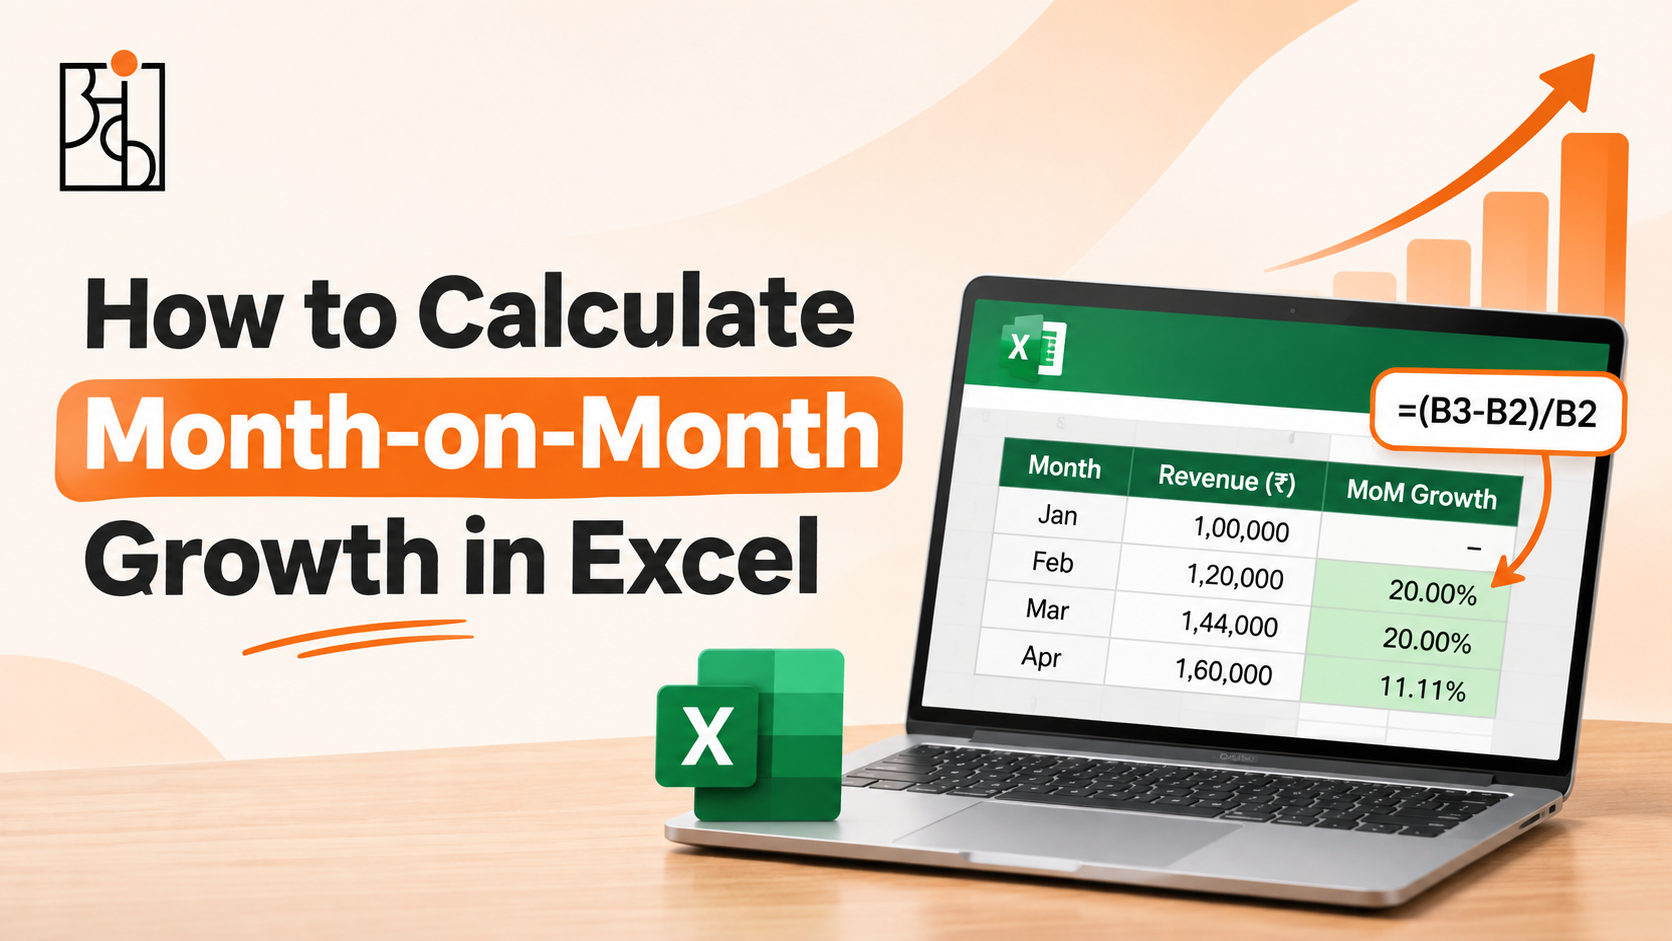
The formula for this is simple. Take the value for this month, minus the value for last month. Divide by the last month’s value. In Excel it is easy to do once you have your data set up correctly.
How to calculate it.
What is Month-on-Month Growth?
Month on Month Growth simply shows you how good you did this month compared to last month.
A positive number means growth and a negative number means a decrease. If we look at a trend over several months we can see IF our performance is increasing, decreasing or being volatile.
This can be particularly useful for tracking short-term performance. YoY growth is better for longer term trends, but MoM gives you quicker insights.
Step 1 – Set up your data
We need to create two columns:
Column A to show the months (Jan, Feb, Mar… or actual date)
Column B to show the value we want to track (Revenue, Orders, Users etc.)
For example:
Month Revenue
Jan 50,000
Feb 55,000
Mar 52,000
Apr 61,000
Ensure the months are in order and no blank rows in between. It is best to format this as an Excel Table (Ctrl + T) so that the formula will expand automatically as you add new months.
Step 2 – Create your formula
In Column C, starting from the second month (Row 3 IF headers are in Row 1):
excel
=(B3-B2)/B2
This is simply taking the previous month’s value away from the Current Month and dividing by the Previous Month.
Change the cell to a Percentage format. Excel will now show you the growth as 10%, -5.45%, 17.31% etc.
Drag this formula down.
Read More: What Happens When Data Is Inaccurate?
Step 3 – Deal with the first month
When you get to the first month you will see an error or a strange number as there is no Previous Month. There are two clean ways to deal with this.
Option A – Leave blank
Simply start the formula from the second month. The first growth cell will be blank.
Option B – IF Function
“`excel
=IF(B2=0,””, (B3-B2)/B2)
“`
Or use this version to show a dash:
“`excel
=IF(B2=0,”–”,(B3-B2)/B2)
“`
This keeps the column nice and clean.
Read More: What Is Data Fluency? Why It Matters for Every Business
Step 4 – Add absolute references or tables
If your data is in an Excel Table the formula can be a structured reference and will expand as you add new data.
If your data is more complicated you could use INDEX or OFFSET to calculate the growth in a summary section. However, the method above works well.
Step 5 – Add Conditional Formatting (optional but helpful)
Highlight your growth column and go to Conditional Formatting.
Add a rule to highlight green IF the growth is positive and red IF negative.
Common Variations
Growth vs Same Month Last Year
This is actually YoY growth. The formula is very similar, but we are comparing against the value 12 rows above.
Average Monthly Growth
You can use the geometric growth formula. Or IF you just want a rough idea you can average out the monthly growth. If you want to know the accurate compounded growth you will need a different formula.
Multiple Metrics
Once you have calculated the growth for one column you can easily copy the formula across to other metrics (Orders, New Customers etc.)
Top Tips
Always ensure the Previous Month value isn’t zero. This would cause errors in the formula.
Keep your raw data and growth percentages in separate columns. Otherwise your sheet will be difficult to manage.
When showing results always include both the actual figure and percentage. If your figure is very small, a 50% increase might look more impressive than it really is.
Ensure you update your data in the same format every month.
Ankashram focuses on practical programmes like Think with Data to help you understand how to calculate these figures and present them in a way that provides clarity to your business. Whilst knowing how to calculate growth is useful; understanding what it actually means will provide greater value.
Frequently Asked Questions
Q1.What is the exact formula for month on Month Growth in Excel?
The formula is (Current Month – Previous Month)/Previous Month. Ensure you have a percentage format.
Wrap your formula in an IF function to check IF the Previous Month value is zero. Or simply start the formula from the second month.
Q2.Can I use a Pivot Table to calculate MoM growth?
Yes! Put your months in the rows, metric in values and create a calculated field. Or go to Show Values As > % Difference From > Previous Month. (In newer versions of Excel it is very easy)
Q3.Is month on Month Growth the same as month over month?
Yes.
Q4.Should I use month on month or year on year?
Use month on month for short term performance and quick insights. Use year on year to eliminate seasonal affects and see longer term trends. Many dashboards will show both.
Q5.How does Ankashram teach these practical skills?
Ankashram focuses on giving you skills that you can use in your business. We focus on not only calculating your metrics correctly, but understanding what they mean and how they can affect your decisions.