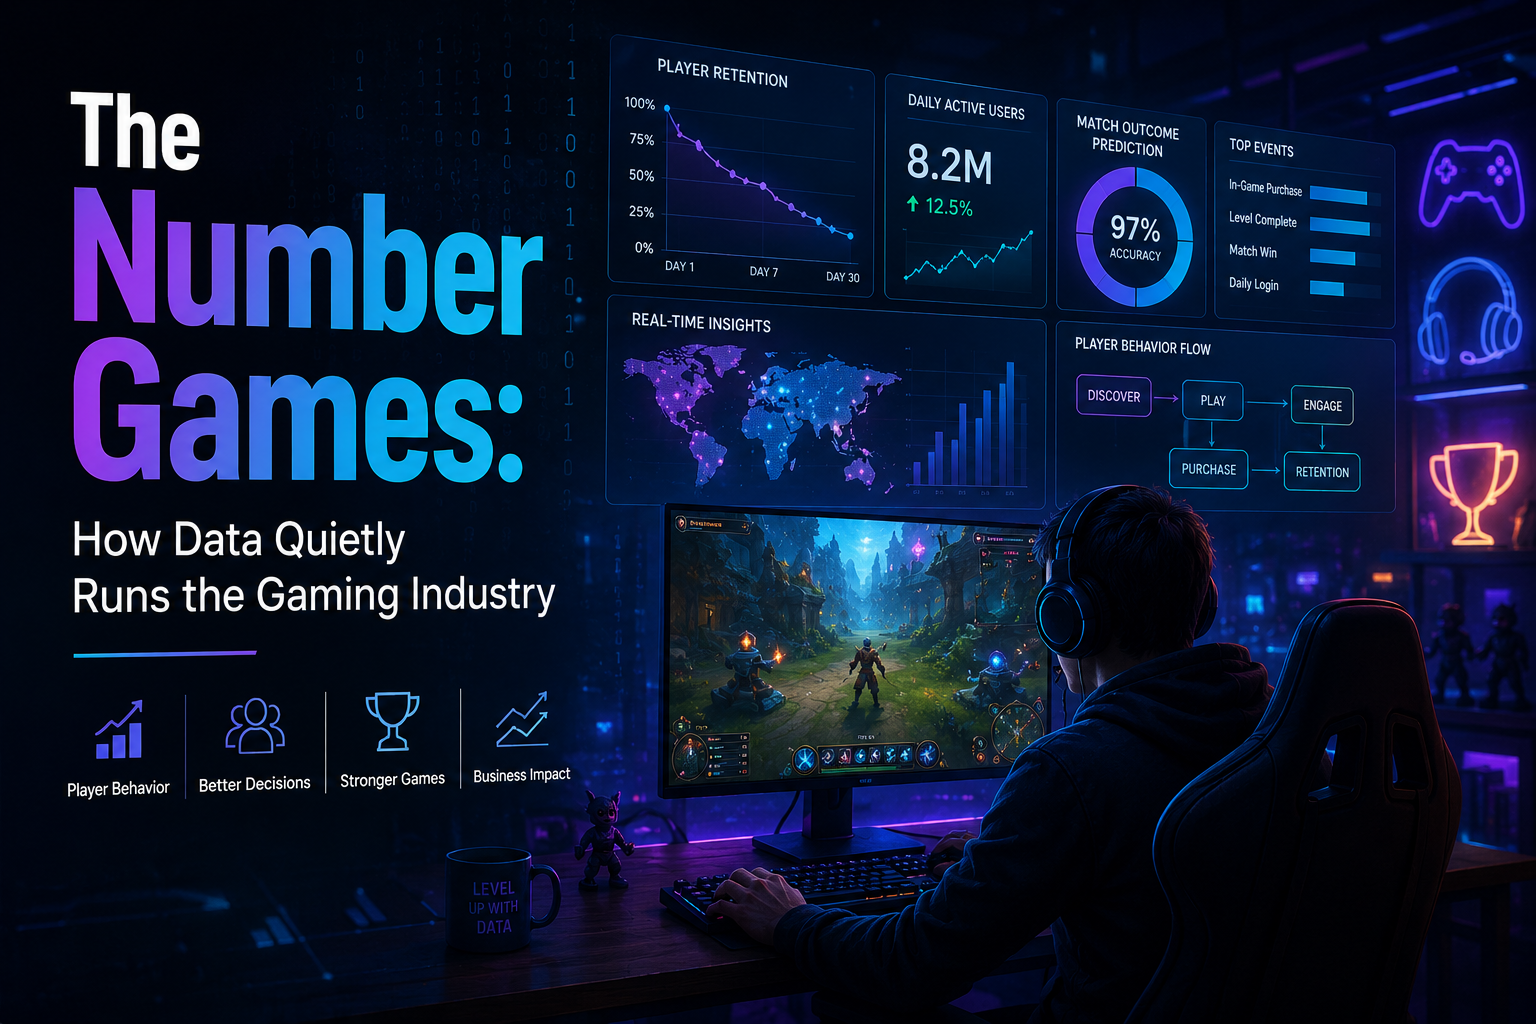
The Number Games: How Data Quietly Runs the Gaming Industry
Level 65 of Candy Crush Saga used to have a cult following. Not the good kind. Players hit it, got stuck, and a chunk of them just never came back — badly enough that fan forums built entire threads dedicated to complaining about it. King’s data team noticed the drop-off first in the numbers, not in the forums. The progression funnel, which tracks how many players make it from one level to the next, showed a steep cliff right at level 65, long before anyone at the company read a single angry post about it. The level was originally meant to be the final stage of the Gaming Data Analytics, and its difficulty made it both the highest-converting level King had ever shipped and, at the same time, the single biggest source of player churn in the entire title. Two good outcomes and one bad one, all coming out of the same design decision.
Table of Contents
King’s answer wasn’t dramatic. They pulled the difficulty down a notch. The progression funnel evened out almost immediately — the cliff at level 65 became a gentle slope like every other level around it. That’s the whole story, more or less, and it’s also a fairly honest summary of what data analytics actually does inside a gaming company. It’s not there to make a game smarter in some abstract sense. It’s there to notice the exact moment a player quietly gives up, before that player has any reason to tell anyone why.
What’s more interesting is what happened a few years later, when King ran a very different experiment on Candy Crush Soda Saga. The team wanted to know whether a harder opening stretch would make the game feel more satisfying to newcomers, so they shipped a tougher version of the first 30 levels to a slice of players and watched what happened. Second-day retention dropped almost immediately — normally the kind of result that gets an experiment killed within 48 hours. King let it run anyway, mostly out of curiosity about where the data would eventually settle. Two weeks in, the numbers flipped entirely: the players who’d struggled through that harder opening were sticking around longer than the control group who’d had it easy. The short-term read and the long-term read told two completely different stories, and only one of them turned out to matter for the business. That’s the part of gaming analytics most outsiders miss — it’s rarely about finding an answer once and moving on. It’s about staying suspicious of the first answer you get, because in a game with millions of players and years of lifetime value at stake, week one and week fourteen can point in opposite directions.
League of Legends, and the problem of too much data
Riot Games has a different kind of problem than King does. League of Legends pulls in something like 100 million active players, and every single match throws off a genuine flood of data — who fought whom, when, with which champion, for how long, who died and who didn’t, who bought which item at what minute mark. At that scale, the hard part stops being “what do we look for” and becomes “how do we even process this fast enough for it to matter.” Riot leans on Apache Spark’s real-time processing specifically to catch operational problems while they’re still happening — a spike in disconnects, an unstable server region — rather than reconstructing what went wrong after a wave of angry support tickets shows up the next morning.
The more interesting use of all that data, though, isn’t operational at all. It’s predictive. Researchers working with Riot’s public match API trained deep learning models on roughly 154,000 games and hit 97% accuracy predicting match outcomes — and not just at the final second, when the outcome is obvious to anyone watching. The models could identify which in-game signals actually mattered at each stage of a match: gold leads early on, vision control in the mid-game, objective timing as things wound down. That’s not a party trick for a conference slide. It tells Riot’s design team, with real precision, which mechanics are actually deciding games, as opposed to which mechanics players say they enjoy or complain about on Reddit. Those two answers don’t always line up. A champion can feel unfun to play against while contributing almost nothing to actual win rates, or the reverse — quietly overpowered while nobody’s complaining yet because it hasn’t been “figured out.” The gap between perceived impact and measured impact is usually where next season’s balance patch actually comes from, more than any single player’s Reddit thread.
There’s a second layer to this too, less flashy but arguably more consequential: cohesion and team dynamics. Academic work built on the same Riot API has found that measures of how well a team perceives itself to be working together — essentially a proxy for communication and trust — predict match victory almost as reliably as raw individual skill does. Riot doesn’t just have a mechanical model of what wins games. It has a social one, buried in the same dataset, telling a slightly different but equally real story about why some five-person groups of strangers win and others fall apart.
Dream11 and the scale problem, India edition
If Riot’s challenge is depth, Dream11’s is sheer volume, and it’s a genuinely Indian scale problem. During marquee IPL matches, the platform has reported handling somewhere north of 40 million requests per minute, with tens of millions of users live at once, all of them refreshing fantasy scores as real cricket unfolds ball by ball. Underneath that load sits a large in-house data pipeline — by some public accounts processing several terabytes a day — feeding machine learning models that decide things like which contests to recommend to a given user, how to price a player’s fantasy value, and increasingly, whether a particular account is behaving like a real cricket fan or like a bot running fraud.
What’s worth sitting with here isn’t the scale by itself. It’s what Dream11 chose to spend that scale on. Not just faster servers to survive IPL traffic spikes — personalization, layered several algorithms deep. Recency-frequency-monetary tracking to understand who’s active and who’s drifting, collaborative filtering to guess what a user might try next, contextual bandits to test small variations in real time without waiting for a full A/B cycle to finish. It’s essentially the same toolkit an e-commerce company would use, repurposed for cricket contests. Dream11’s own data science leadership has described the logic behind this fairly plainly in public talks: acquiring a fantasy sports user in India is expensive and getting more so every season, competition among fantasy apps is brutal, so the real lever isn’t getting someone to download the app once — it’s getting them to open it every single match day for years. That’s a retention problem wearing a cricket jersey, and it gets solved the same way retention gets solved everywhere else in consumer tech: by knowing a user’s habits well enough to predict what brings them back, ideally before they’ve consciously decided to leave.
Call of Duty and the fight over what “fun” even means
Not every gaming analytics story is about retention curves and funnel charts. Some of it is about a fight between what the data says and what a very loud slice of the player base insists is true, even when the numbers disagree with them.
Skill-based matchmaking in Call of Duty has been one of the most contested topics in the entire franchise since roughly 2014, and Activision has spent years alternating between silence and increasingly detailed public defenses of the system. In 2024 the company published an 18-page report, followed later by a 25-page white paper, laying out years of internal testing. The most telling experiment in that data wasn’t even about tightening matchmaking — it was about loosening it. Activision quietly reduced how strictly skill was weighted in matchmaking for a slice of players in Modern Warfare 3, without announcing it, specifically to see whether the vocal anti-SBMM crowd was right that a looser system would feel better. It didn’t. Quit-mid-match rates went up, total hours played went down, and players with a wider skill gap between them were measurably more likely to abandon a match in progress and not come back. When Activision tried the opposite experiment — tightening skill weighting even further and protecting the bottom 25% of players — quit rates for low-skill players dropped by roughly 90%, but it visibly hurt the experience for the highest-skilled players, so that version got scrapped too.
None of this settled the argument, and that’s the part worth paying attention to. Activision published two lengthy, data-dense documents specifically to convince a skeptical community, and large parts of that community simply didn’t believe them, or didn’t care — Black Ops 7 later removed SBMM from most of its playlists anyway, under sustained pressure, despite Activision’s own numbers suggesting that change would likely hurt retention for a meaningful chunk of players. It’s a useful reminder that in gaming, unlike in most industries, the “customers” are also a vocal, organized, highly online constituency who can simply refuse to accept a data-backed conclusion, and a studio has to decide how much weight to give player sentiment when it’s actively contradicted by the retention numbers sitting in front of them.
Where the data was right and nobody listened anyway
Star Wars Battlefront II is the example everyone in the gaming industry still reaches for when this exact tension goes wrong in the other direction — where the studio picked the numbers over the sentiment, and paid for it. EA’s loot box system priced out iconic characters like Luke Skywalker and Darth Vader behind what independent estimates put at roughly 40 hours of grinding, unless a player paid extra on top of the game’s $60 box price. EA almost certainly had the internal data to know exactly how that system would perform financially — average credit-earn rates per player per day, conversion curves pulled from earlier loot-box titles, probably a reasonably accurate forecast of how much extra revenue the grind would generate. When EA tried to publicly defend the credit system, describing it as designed to give players “a sense of pride and accomplishment,” the response became the most downvoted comment in Reddit’s history, racking up over 675,000 downvotes. Lawmakers in Belgium, Hawaii, the UK, and Australia started publicly asking whether loot boxes amounted to gambling. EA disabled microtransactions entirely less than 24 hours before the game’s official launch, wiping out a monetization system it had presumably spent months modeling.
The lesson isn’t that the data was wrong. The numbers on earn rates and conversion were almost certainly accurate. What broke was the assumption sitting underneath the data — that players would tolerate being priced out of characters in a full-price game they’d already paid for, as long as the monetization curve looked healthy on an internal spreadsheet. Good analytics can tell a studio exactly how a system will perform financially and say absolutely nothing about whether players will feel cheated by it. Those are two separate questions, and Battlefront II is the clearest case study in what happens when a studio answers only the first one.
What actually ties these together
Strip away the specific games and a pattern shows up across all five of these stories. King’s data didn’t just report a churn problem at level 65 — it changed the difficulty curve for millions of players who never knew an experiment had happened to them. Riot’s win-prediction models don’t just describe what wins matches after the fact, they quietly steer which champions get nerfed the following season. Dream11’s personalization stack isn’t reporting on user behavior after the match ends, it’s actively deciding what a user sees the next time they open the app during a live game. Even Call of Duty’s matchmaking fight is really about a company that closed the loop between data and design decisions and then had to publicly defend that loop against a community that experienced the same numbers completely differently. In every one of these cases except one, the analytics stopped being a report and started being an input that fed straight back into the product — the loop closes, and the next round of data reflects a decision the last round of data made.
Battlefront II sits slightly apart from the other four, and that’s worth sitting with rather than glossing over. It’s the one story here where the data pipeline worked exactly as intended and the outcome was still a disaster, because the numbers being tracked — credit-earn rates, purchase conversion — never had a column for how it would actually feel to grind 40 hours for a character everyone recognizes from the poster on the box. Gaming analytics, probably more than most industries, sits directly on top of something that resists being fully quantified: whether the game is still fun once every part of it has been measured, tested, and optimized. The studios that seem to get this right, King and Riot included, tend to be the ones still asking that question out loud even after the dashboard says everything’s fine.
Frequently Asked Questions
Q1.Why did King let the harder Candy Crush Soda Saga experiment keep running after retention dropped?
Because a single early metric — second-day retention — didn’t tell the whole story. The team’s willingness to sit with a bad-looking short-term number long enough to see the two-week trend is exactly what surfaced the counterintuitive result. Killing the experiment at the first sign of a dip would have hidden a genuinely useful finding.
Q2.Is skill-based matchmaking actually bad for Call of Duty players?
The data Activision published suggests it depends which players you’re asking. Loosening SBMM increased quit rates and hurt overall engagement, especially for lower-skilled players, while tightening it protected weaker players but visibly frustrated top-tier ones. There’s no single answer that satisfies the whole player base, which is part of why the debate has never fully settled.
Q3.What made Riot’s win-prediction models so accurate?
Training on a genuinely large dataset — roughly 154,000 matches — let the models isolate which specific signals (gold leads, vision control, objective timing) actually correlated with winning at each stage of a match, rather than relying on assumptions about which mechanics feel important to players.
Q4.Could Dream11 or Riot’s models be gamed by players who know how they work?
To some extent, yes — any system built on measurable player behavior creates an incentive to optimize for the metric rather than the underlying goal. This is a known tension in game analytics generally, and part of why studios tend to keep the exact weighting of these models private rather than publishing them in full.
A note on the examples in this piece
- Real company and product names are used only for illustration.
- Ankashram is not affiliated with or sponsored by any mentioned brand.
- Numbers and processes are simplified examples, not official disclosures.
- Refer to companies’ official statements for accurate information.