How to Become a Data Analyst Without Technical Skills
There’s a sentence that confuses almost everyone the first time they hear it: you don’t need technical skills to become a data analyst. Sounds backwards, right? This is literally a technical job. But it’s true in a way that most career advice glosses over. Nobody’s born knowing SQL. Nobody comes out of college already fluent in pandas. Every analyst working today started at zero — most of them without a computer science degree, plenty coming from something totally unrelated. Commerce. Biology. English lit. A decade in retail management.
Table of Contents
What that sentence actually means is: technical skills aren’t a gate you need to get through before you start. They’re something you build as you go, and the starting point is a lot more human than a coding bootcamp would have you believe.
We get some version of this question constantly at Ankashram, usually from people who’ve talked themselves into “I’m not technical enough” or “I’m too old to learn this” or “I’m just not a math person,” and they’re really just looking for permission to try anyway. So let’s actually walk through what gets you there — starting with the thing nobody puts first on these lists, even though it should be.
Analytical Thinking Comes Before Any Tool
If there’s one non-negotiable starting point, it’s this — and here’s the good part, you already have some version of it, whether you realize it or not. Analytical thinking isn’t really about numbers. It’s the habit of asking “why” one more time than feels natural, instead of just accepting the first explanation that pops into your head.
Ever tried figuring out why a recipe didn’t turn out right? Or why your phone battery drains faster some days than others? Or worked out why one approach at your job kept flopping while a slightly different one worked fine? Congrats, that’s analytical thinking. You’ve been doing it your whole life without a spreadsheet in sight. What’s missing is pointing that same instinct at actual data on purpose.
This one improves mostly through doing, not studying. Pick something you’re genuinely curious about — your own spending, your sleep, how much time you burn on your phone — and ask something specific about it. Not “how do I spend my money,” that’s too fuzzy to actually investigate. Try “did my spending go up after I started using a delivery app, or does it just feel that way?” That kind of sharp, testable question is the actual seed of every good analysis. The tools come later. This habit comes first, and honestly it’s the thing that makes every tool you learn afterward worth learning at all.
Excel: Unglamorous, But It’s Everywhere
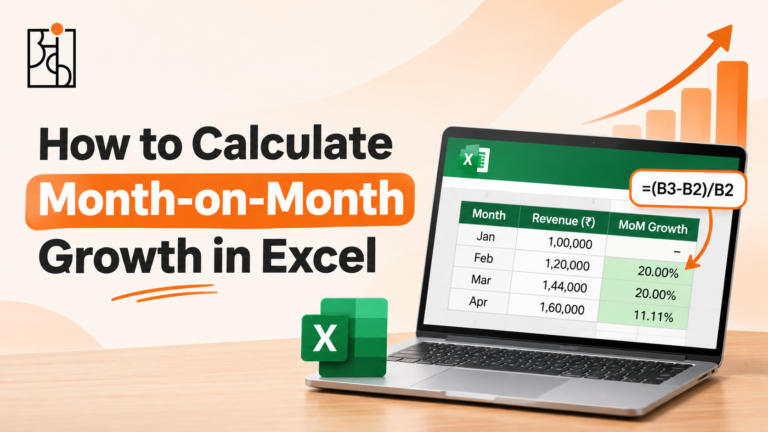
If analytical thinking is the mindset, Excel is usually where the hands-on part actually begins — and not out of nostalgia. It’s genuinely still the most-used data tool in offices worldwide. It’s already installed on nearly every work computer, there’s no setup headache, and the learning curve is gentle compared to basically anything code-based.
Start simple. Sorting, filtering, basic formulas like SUM and AVERAGE and COUNTIF. Then move to VLOOKUP, or its newer and better cousin XLOOKUP — genuinely one of the most useful things you can know in any office job, technical or not. Pivot tables come next, and this is usually where people have their first real “oh wait, this is actually powerful” moment, because suddenly thousands of messy rows collapse into a clean summary table with a few clicks.
You don’t need to know every function Excel has ever shipped. You need to stop being intimidated by a spreadsheet, and feel comfortable enough to poke around when you hit something new. That comfort matters more than any specific formula, and it carries straight into everything else on this list. If you want a structured way to build that comfort instead of piecing it together from random tutorials, this is exactly the kind of foundational skill Ankashram’s courses are built around.
SQL: You’re Just Learning to Ask a Database Questions
This is usually where people who thought they weren’t “technical” start sweating a little, and it’s worth saying clearly upfront: SQL is way friendlier than it looks from the outside. It’s not really programming in the sense most people imagine — no loops, no nested logic gymnastics. Mostly it’s about phrasing what you want clearly.
At its core, SQL is a way of asking a very literal, very patient assistant for specific information. “Show me every customer who bought something in the last month” becomes a SELECT with a WHERE clause. “Pull data from two different tables and combine it” becomes a JOIN. The syntax takes some getting used to, sure, but the underlying logic tracks pretty closely to how you’d phrase the same question out loud to a coworker.
Start with SELECT, WHERE, basic JOINs. Once that feels okay, move to GROUP BY and aggregates — COUNT, SUM, AVG — since that’s what actually lets you summarize data instead of just retrieving it. Window functions and query optimization can wait. They matter more for senior-level interviews, not for the first month of learning. Ankashram’s SQL content follows roughly this same order for exactly that reason — get the basics solid before chasing the advanced stuff.
Data Visualization: Making Numbers Actually Say Something
Here’s a pleasant surprise for a lot of career-changers: visualization is one of the friendlier entry points into this whole field, because a decent chunk of doing it well isn’t technical at all — it’s design instinct and communication sense, which you might already have from a job that has nothing to do with data.
Power BI and Tableau both went drag-and-drop specifically because nobody wanted visualization to require heavy coding. The mechanics — building a bar chart, adding a filter, connecting a source — are genuinely some of the faster things to pick up on this whole list, and it’s one of the areas where a guided course (Ankashram included) tends to save people real time over trial and error.
Watch the Ankashram video: How to Become a Data Analyst in 2026.
The harder part, the part that actually separates good dashboards from bad ones, is knowing which chart fits which question. Line chart for a trend over time. Bar chart for comparing categories. Scatter plot for a relationship between two things. And please, resist the urge to reach for a pie chart just because it’s familiar — human eyes are genuinely bad at judging angles, so pie charts usually communicate less clearly than people assume. Spend time looking at dashboards you find clear and easy to read, and try to figure out why they work. That instinct grows faster from noticing good examples than from watching tutorials.
Statistics: Less Scary Than the Version You Remember From School
This is the one people dread most, usually thanks to some miserable memory of a stats class built around memorizing formulas with no context. Good news: you don’t need that version. You need the practical “okay but what does this actually tell me” version.
Start with mean, median, and mode, and notice how differently they can each describe the same data — a company’s “average” salary can look great on paper while most employees earn nowhere near that number, because a couple of executives are dragging the average way up. Then get comfortable with variance and standard deviation, which really just answer “how spread out is this, and should I actually trust this average?”
From there, correlation versus causation deserves serious attention, because mixing these two up is probably the single most common analytical mistake made in business settings, full stop. Ice cream sales and drowning incidents both spike in summer — that doesn’t mean one causes the other. Heat causes both. Once that clicks, basic hypothesis testing and a rough intuitive sense of what a p-value means round out enough statistics to hold your own in most junior analyst roles.
Business Understanding: The Skill That Makes Everything Else Worth Doing
Here’s an underrated truth: someone with modest technical chops but sharp business sense often produces more useful work than someone with excellent technical skills and zero feel for why any of it matters. Genuinely good news if you’re coming from a non-technical background, because business understanding is exactly what prior work — sales, operations, customer service, retail, whatever — actually hands you for free.
Knowing how a business makes money, what a “good” customer actually looks like, why marketing obsesses over one metric and ignores another — that context is what turns a technically correct analysis into a genuinely useful one. An analyst who actually gets why a 2% jump in churn is alarming (because of what that compounds into across a year) is going to give a sharper recommendation than someone who just reports the number flatly.
If you’re switching careers into this field, don’t treat your old industry knowledge like dead weight while you cram new technical skills. It’s often your real edge over people who learned the tools first and never picked up the business sense at all.
Read More : 10 Best Data Analytics Tools for Data Analysts in 2026: A Practical Guide
Communication: The Skill Most “Technical” People Skip Entirely
This might be the single biggest opening for someone without a technical background, because — a little ironically — plenty of very technically skilled analysts are genuinely bad at explaining their own work. If you’ve ever explained something complicated to a confused relative, a customer, or a new hire, you already have the raw material for this.
The core of good data communication is brutal prioritization — knowing which one number actually matters, and leading with that instead of narrating your entire process. Nobody outside your team cares that you tried four approaches before finding the right one. They care about the conclusion, and what they’re supposed to do about it.
Practice explaining findings in layers: one sentence for someone with thirty seconds, a paragraph for someone with five minutes, the full breakdown for whoever actually wants it. This one habit gets analysts noticed and promoted faster than any polished dashboard ever will, because it’s what actually makes their work usable instead of just impressive to look at.
Problem-Solving: Turning a Vague Mess Into Something You Can Actually Test
Problem-solving overlaps heavily with analytical thinking, but there’s a distinct piece worth pulling out — the ability to take a fuzzy, real-world problem and break it into something data can actually answer. “Sales are down” isn’t analyzable as-is. Turning that into testable pieces — is this regional or everywhere, did it start before or after some specific change, is one product category dragging the rest down — that breakdown is the actual work of problem-solving here.
This gets sharper with deliberate practice. Every time someone hands you (or you invent for yourself) a vague business question, force yourself to write two or three specific, testable sub-questions before you touch any data at all. That one habit alone puts you ahead of a lot of people who jump straight into analysis without ever sharpening the question first.
Read More : Online vs Offline Data Analytics Course Which Is Actually Better?
Python: The Skill That Can Wait Longer Than People Assume
Python shows up on every “must-learn” list, and while it’s genuinely useful, it’s also completely fine to treat it as a second-stage skill instead of something you need in month one. Once you’re solid on SQL and Excel, Python — mainly pandas for data manipulation, plus basic matplotlib or seaborn for simple charts — extends what you can actually do, mostly around automating repetitive work and handling messier or bigger datasets than a spreadsheet can comfortably hold.
Don’t let Python anxiety stall your whole plan. Plenty of people land their first analyst job with solid SQL and Excel and pick up Python once they’re already in the role and can see exactly where it’d save them real time. Learning it that way — solving one specific, real annoyance — sticks a lot better than learning it abstractly from a course with nowhere to apply it.
Read More : Data Analyst Course: Syllabus, Roles and What It Actually Costs in 2026
AI Skills for Data Analysts: A Newer Addition, and Honestly a Shortcut
Here’s some good news if you’re worried you’re starting too late: AI tools have actually made this field more accessible, not less. A modern AI assistant can write a first-draft SQL query from a plain-English description, explain a confusing chunk of code line by line, or help you debug an error message that used to eat an hour of forum-searching.
The real skill here isn’t “knowing AI” in some vague sense — it’s learning to treat these tools as a genuinely useful assistant while staying a bit skeptical of what they hand you. Ask an AI to write something, then actually read it before you run it anywhere important. Ask it to explain a concept, then double-check that explanation somewhere else if it’s going into a real decision. That habit of verifying — more than raw AI fluency — is what separates people who use these tools well from people who get burned by a confidently wrong answer.
Portfolio Projects: Proof You Can Actually Do This
Eventually, skills need to turn into evidence, and that’s what a portfolio is for. It doesn’t need to be groundbreaking. It needs to show the full arc of a real analysis — an actual question, some messy real data, a cleaning step, an analysis, and a clear conclusion you can explain well.
Pick something you actually care about. Look into public transit delays where you live. Dig into how your own spending shifted over the year. Poke around public sports stats if that’s your thing. The specific topic matters way less than doing the whole cycle properly and being able to talk through your choices afterward — why you cleaned the data that way, why that chart and not another one, what you’d dig into next given more time. Two or three well-explained projects beat ten shallow ones, because interviewers usually want to go deep on one rather than skim a pile. If you’re not sure what a solid first project even looks like, Ankashram has project walkthroughs specifically aimed at this stage — worth a look before you pick your topic.
Read More : How Data Analytics Helps Businesses Think With Data
Think With Data: Where All These Pieces Actually Connect
This is the part most beginners miss, because they treat the list above as a checklist instead of a system. Learning SQL doesn’t make you an analyst. Neither does Excel. Even having every individual skill above, learned in isolation, doesn’t quite get you there. What actually makes someone a data analyst is the ability to think with data — moving smoothly from a real business question, to the right tool for that specific question, to a clearly communicated answer, and back again when that answer raises the next question.
That’s why analytical thinking opens this list and communication sits near the end, even though they might look like the “soft” bookends around the real technical stuff. They’re not soft at all. They’re the connective tissue holding everything together. A sharp question with no technical ability to chase it down goes nowhere. Flawless technical execution on the wrong question is just as useless. The actual craft here lives in the connection — asking something worth asking, picking the right tool without overcomplicating it, and explaining the answer so someone can actually use it.
This is also where a lot of self-taught learners quietly get stuck without noticing — they keep stacking up tools without ever practicing the thinking that ties them together. Whether you’re learning through Ankashram or anywhere else, it’s worth deliberately practicing that synthesis and not just each skill on its own. Take one real question and walk it the whole way through — Excel or SQL, into a chart, into a one-paragraph explanation — every time you practice, not just the technical middle bit.
Getting Started Without Drowning in the List
If this all feels like a lot right now, that’s a completely normal reaction, and worth saying out loud: nobody learns all of this at once, and trying to is a great way to quit within a month. A reasonable order looks something like this — get comfortable with Excel and basic analytical thinking first, since neither needs code and both build real confidence fast. Add SQL next, since that’s what opens the door to real datasets instead of toy examples. Layer in a visualization tool and just enough statistics to interpret your own results honestly. Build your first portfolio project once you’ve got those four pieces, even if it feels rough around the edges. Then bring in Python and deeper AI-tool comfort once the fundamentals are solid, treating them as accelerants rather than starting points.
None of this needs a computer science degree, a math background, or some innate “technical personality” some people apparently have and others supposedly don’t. It needs curiosity, a fair amount of patience while things feel clunky, and enough persistence to actually finish a couple of real projects instead of endlessly watching tutorials. Whether you learn through Ankashram, another platform, or entirely on your own, the technical skills are learnable by pretty much anyone willing to sit through the awkward beginner phase. What actually decides whether someone becomes a genuinely good analyst isn’t where they started. It’s whether they kept asking sharp questions the whole way through.
Read More : Data Analyst Interview Questions and How to Prepare
Frequently Asked Questions
Q1.Can I really become a data analyst without any coding background?
Yes, genuinely. Most working analysts started with zero coding experience. SQL, Python, visualization tools — these are all learnable through consistent practice. They’re not a gate you need to pass before starting, they’re something you pick up along the way.
Q2.Which skill should come first if I’m starting from scratch?
Excel and basic analytical thinking, in that order. Neither needs code, both build quick confidence, and Excel habits like filtering and pivot tables carry straight into how you’ll later think about SQL and data cleaning.
Q3.Do I need Python to land a data analyst job?
Not right away. A lot of entry-level and even mid-level roles run mainly on SQL, Excel, and a visualization tool. Python earns its keep once you’re automating things or dealing with bigger datasets, and it’s totally fine to pick it up once you’re already job-hunting or working.
Q4.Does a portfolio matter more than certifications?
Generally, yes. Certifications show you studied something. A portfolio shows you can actually do the work — ask a question, clean the data, analyze it, explain the result clearly. Two or three well-explained projects tend to carry more weight in interviews than a stack of certificates ever will.
Q5.Is business understanding actually a “skill,” or do I already have it?
If you’ve worked in any industry at all — retail, customer service, operations, whatever — you already have real business context, and it’s worth treating as a genuine asset rather than something separate from “real” data skills. It’s often exactly what turns a technically fine analysis into a genuinely useful one.
Q6.How do AI tools fit into learning this as a beginner?
As a real accelerant. AI can draft SQL, explain confusing code, or clarify a stats concept you’re stuck on. The important habit is checking what it gives you instead of trusting it blindly — treat it as a fast assistant, not a stand-in for actually understanding the work yourself.