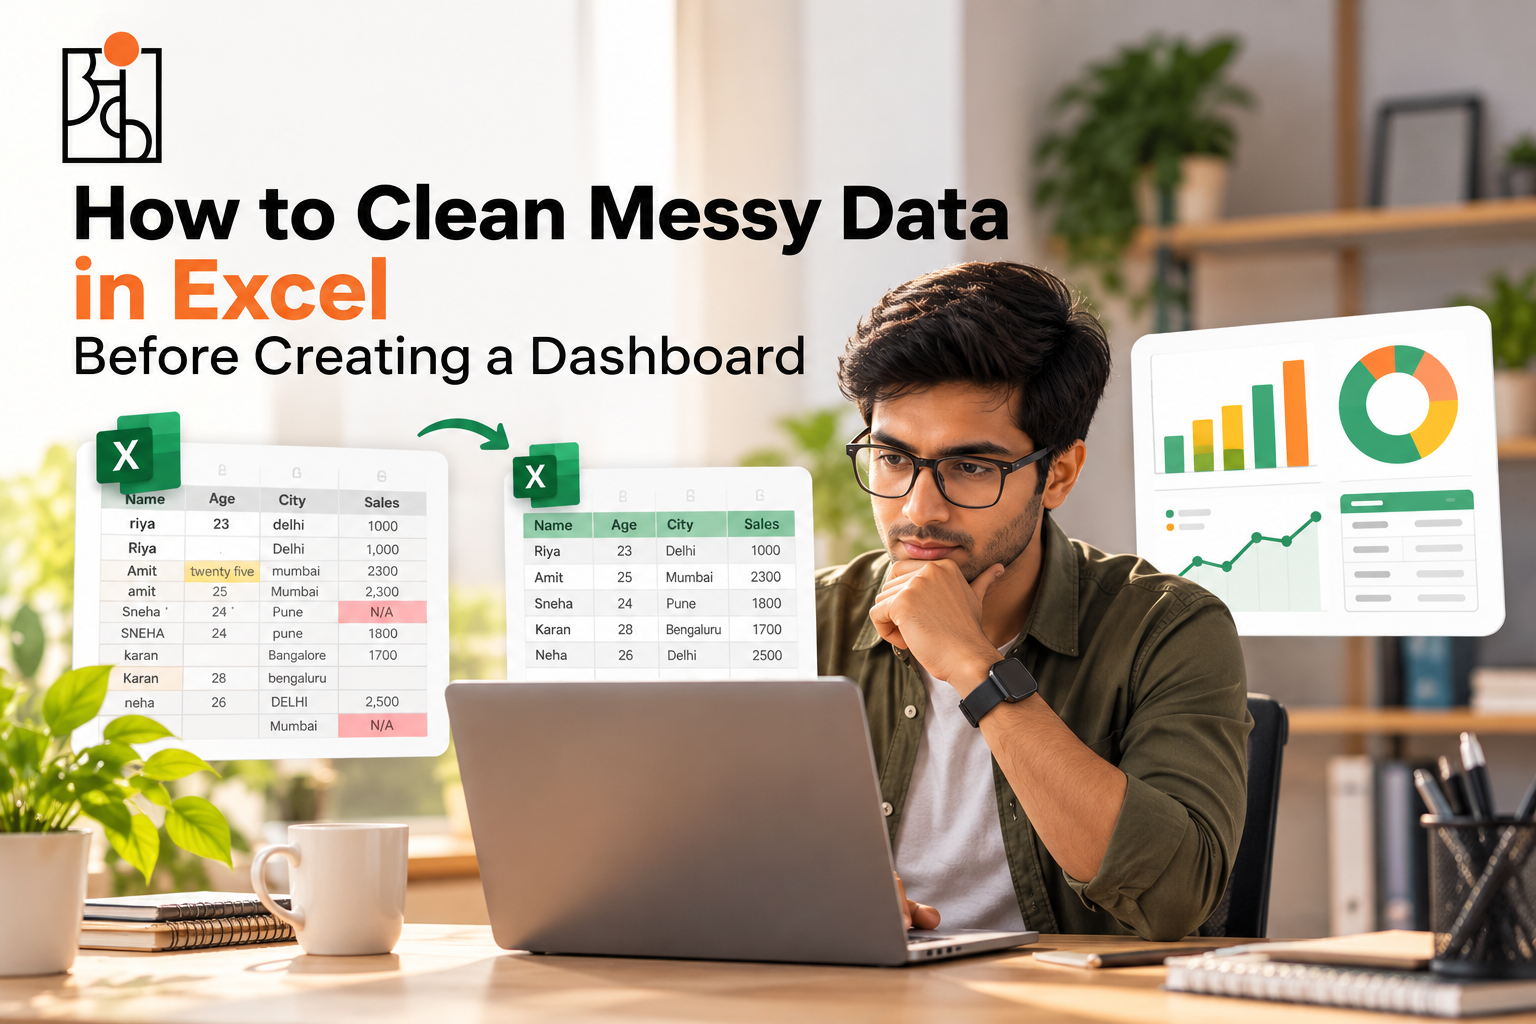
How to Clean Messy Data in Excel Before Creating a Dashboard
Here’s a trap a lot of people fall into without even noticing. Open Excel, glance at a messy dataset for maybe thirty seconds, and go straight for Insert → Chart. The dashboard looks fine at first. Numbers show up, colors look decent, everything seems to be working the way it’s supposed to. Then someone actually checks the totals against reality, and nothing lines up. Not because the dashboard got built wrong — because the data underneath it was never actually clean in the first place.
Table of Contents
This happens constantly, and it’s almost never really a dashboard-design problem. It’s a cleaning problem, just wearing a dashboard’s clothes. Before any chart, pivot table, or dashboard means anything at all, the data feeding it has to actually be trustworthy — and that trust gets built on purpose. It doesn’t just show up because the formatting looks nice.
Read More: How to Improve Logical Thinking: A Practical Guide to Thinking Critically
Why This Step Gets Skipped So Often
Cleaning data isn’t fun, let’s just say that up front. There’s no satisfying visual payoff the way there is with a finished chart, so it’s tempting to rush through it, or skip it outright, especially with someone waiting for something presentable. But a dashboard sitting on top of messy data doesn’t just look a little off. It actively misleads whoever’s reading it, and does it with total confidence, because nothing about a polished-looking chart ever hints that the numbers underneath might be wrong.
That’s really the whole risk here. A messy spreadsheet looks messy — people stay cautious around it, almost instinctively. A clean-looking dashboard built on that same messy data looks trustworthy instead, and that’s exactly when people stop questioning it. Fixing the data before it ever reaches a chart is really the only way to close that gap.
Start by Just Looking at What You’ve Got
Before touching a single formula, it’s worth scrolling through the raw data and getting a feel for what’s actually wrong with it. Dates all consistent, or does one row say 04/08/2026 and another say 2026-08-04 like they belong to two different systems entirely? Category names spelled the same way throughout, or is “North Region” also showing up as “north region” and “North Reg.” somewhere further down the sheet? Any blanks sitting where there really shouldn’t be any?
Nothing gets fixed at this stage. This is just building the mental list of what actually needs attention before any of this is usable for something real.
Read More : Online vs Offline Data Analytics Course Which Is Actually Better?
Standardize Dates Before They Wreck Your Time-Based Charts
Inconsistent dates are one of the most common problems out there, and honestly one of the sneakiest. A dashboard meant to show monthly trends falls apart almost immediately if half the dates are stored as text and the other half as real date values — Excel just can’t sort or group text-formatted dates the way it handles actual ones.
Select the date column, Format Cells, force one consistent format across everything. If some entries snuck in as plain text, a Text to Columns pass under the Data tab usually sorts that out. Feels like a tiny fix. Skip it, though, and you’ll end up staring at a line chart that looks jagged and wrong for no reason you can immediately point to.
Fix the Inconsistent Text and Category Names
Small spelling or capitalization differences cause way more damage than they should, mostly because they’re invisible to a person skimming the sheet but perfectly visible to Excel, which treats “North Region” and “north region” as two completely unrelated entries. That split quietly chops one category into several weaker pieces — and whatever dashboard sits on top of that will quietly understate how much that category actually matters.
Find & Replace handles the obvious ones fast. On a bigger dataset, Data Validation can lock in a dropdown list going forward, so new entries can’t reintroduce the same mess later. Worth doing a proper sweep here too, not just fixing whatever happens to catch your eye — this kind of fragmentation likes to hide in rows nobody’s actually looked at closely.
Read More: How to Think Like a Data Analyst (Even If You’ve Never Touched a Spreadsheet
Handle Missing Values on Purpose, Not on Autopilot
A blank cell isn’t automatically a disaster, but it isn’t automatically safe to just skip past either — treating every blank the same way is where people get into trouble. A blank Discount cell probably just means nothing got applied, and filling it with zero is a reasonable, low-risk move. A blank in Units Sold or Revenue is a whole different story. That blank might mean the sale genuinely didn’t happen, or it might just mean nobody recorded it properly — and guessing wrong here quietly poisons every total that gets built on top of it later.
The safer approach is deciding, column by column, what a blank actually means in that specific context, instead of applying one blanket rule across the entire sheet without really thinking it through.
Remove Duplicates — But Actually Check First
Excel’s Remove Duplicates tool, tucked under the Data tab, handles exact duplicate rows quickly enough. What’s worth being careful about is that not everything that looks like a duplicate actually is one. Two orders with the same product, quantity, and price might just be two separate purchases placed four minutes apart by two different people, not a data entry mistake at all.
Before deleting anything in bulk, spot-check a handful of the rows Excel flags. Just to make sure you’re not wiping out real transactions along with the actual errors.
Read More: Why Data Analytics Projects Matter So Much for Beginners
Check That the Numbers Actually Make Sense
This one gets skipped more than almost anything else on this list, and it’s genuinely one of the most important. Once the formatting issues are sorted, scan the key numeric columns for values that are simply implausible — a discount of 150%, a quantity of -40 units, a price of ₹0 on something that clearly wasn’t free.
Conditional formatting earns its keep here. Set up a rule highlighting anything outside a realistic range — negative numbers in a quantity column, discounts past 100%, whatever fits — and a problem that would’ve been invisible suddenly jumps right off the screen before it ever reaches a chart.
Build Helper Columns Instead of Repeating the Same Formula Everywhere
Once the raw data’s genuinely clean, it’s worth setting up a few calculated columns before diving into any dashboard — a Total Value column (quantity × price × (1 − discount)), say, or a Month column pulled straight from the date field. Doing this once, properly, up front saves rebuilding the exact same formula five separate times across five different charts later, which is both slower and a lot more likely to let some tiny inconsistency slip in unnoticed somewhere.
Do a Final Sanity Check Before Anything Visual Happens
Before the first chart goes anywhere near the screen, compare a few key totals against something independent — a known monthly revenue figure, a rough expected order count, anything that gives you a reality check outside the spreadsheet itself. If the cleaned data’s total revenue looks wildly off from what it should roughly be, that’s worth chasing down now, while it’s still just a number sitting quietly in a cell — not after it’s already been dressed up as a confident, good-looking chart that nobody thinks to question anymore.
Why This Step Matters More Than the Dashboard Itself
It’s easy to treat cleaning as the boring hurdle standing between you and the actually fun part — the charts, the colors, the finished product. In practice, though, cleaning is the actual foundation everything else stands on. A beautifully designed dashboard sitting on unreliable data doesn’t magically become trustworthy just because it looks sharp. It just produces confident, well-formatted conclusions that happen to be wrong, and nothing about how it looks gives that away to whoever’s reading it.
This is a big part of why Ankashram treats data cleaning as a real, core skill — not some quick five-minute chore to rush through before the “actual” analysis begins. A dashboard’s only ever as trustworthy as whatever’s sitting underneath it. No amount of polish fixes a number that was wrong to start with. Teaching that discipline early, before anyone gets too excited about pretty charts, tends to save a lot of grief later — the kind that’s a lot harder to untangle once a flawed dashboard’s already sitting in front of someone making a real decision off it.
A Quick Mental Checklist Before You Touch the Dashboard
Dates standardized into one format. Text and category names consistent all the way through, no accidental duplicates quietly splitting one category into three. Blanks handled on purpose, column by column, not just auto-filled out of habit. True duplicates gone, after an actual spot-check, not a blind delete. Implausible values flagged and actually looked at, not scrolled past. Key totals checked against something outside the spreadsheet itself.
If all that holds up, the data’s genuinely ready for a dashboard. If something on that list doesn’t, that’s exactly where the next ten minutes should go — because catching it now is always cheaper than finding out later, after the dashboard’s already made the rounds and someone’s already acted on it.
Frequently Asked Questions
Q1.Why clean data before building a dashboard instead of after?
Because a dashboard inherits every flaw sitting in the data underneath it, and a polished chart gives absolutely no visual hint that something’s wrong. Fixing things after a flawed dashboard’s already been shared around is a lot harder than catching the problem before anyone’s even seen the final version.
Q2.What are the most common messy data problems people run into in Excel?
Inconsistent date formats, spelling or capitalization differences in category names, blanks handled inconsistently, duplicate rows, and numeric values that just don’t make sense — negative quantities, discounts past 100%, that sort of thing.
Q3.How do I actually fix inconsistent date formats in Excel?
Select the date column, use Format Cells to apply one consistent format across it. If some dates got entered as text instead of real date values, Text to Columns under the Data tab usually converts them properly.
Q4.Should blank cells always just get filled with zero?
No, not always. It really depends on context — a blank discount probably means none got applied, so zero’s a safe fill there. A blank in something core like units sold or revenue needs actual investigation, since guessing wrong quietly throws off every total built on top of it.
Q5.What’s the fastest way to spot implausible values in a big dataset?
Conditional formatting, hands down. Set up a rule that highlights anything outside a realistic range — negative numbers, discounts over 100%, whatever applies — and problems that would’ve stayed hidden suddenly become visually obvious instead of requiring a manual scroll through thousands of rows.
Q6.How does this tie back to what Ankashram actually teaches?
Ankashram treats data cleaning as a genuine core skill, not some quick box to check before the “real” work starts, because a dashboard’s only ever as trustworthy as the data sitting underneath it — and no amount of design polish ever fixes a number that was wrong from the start.